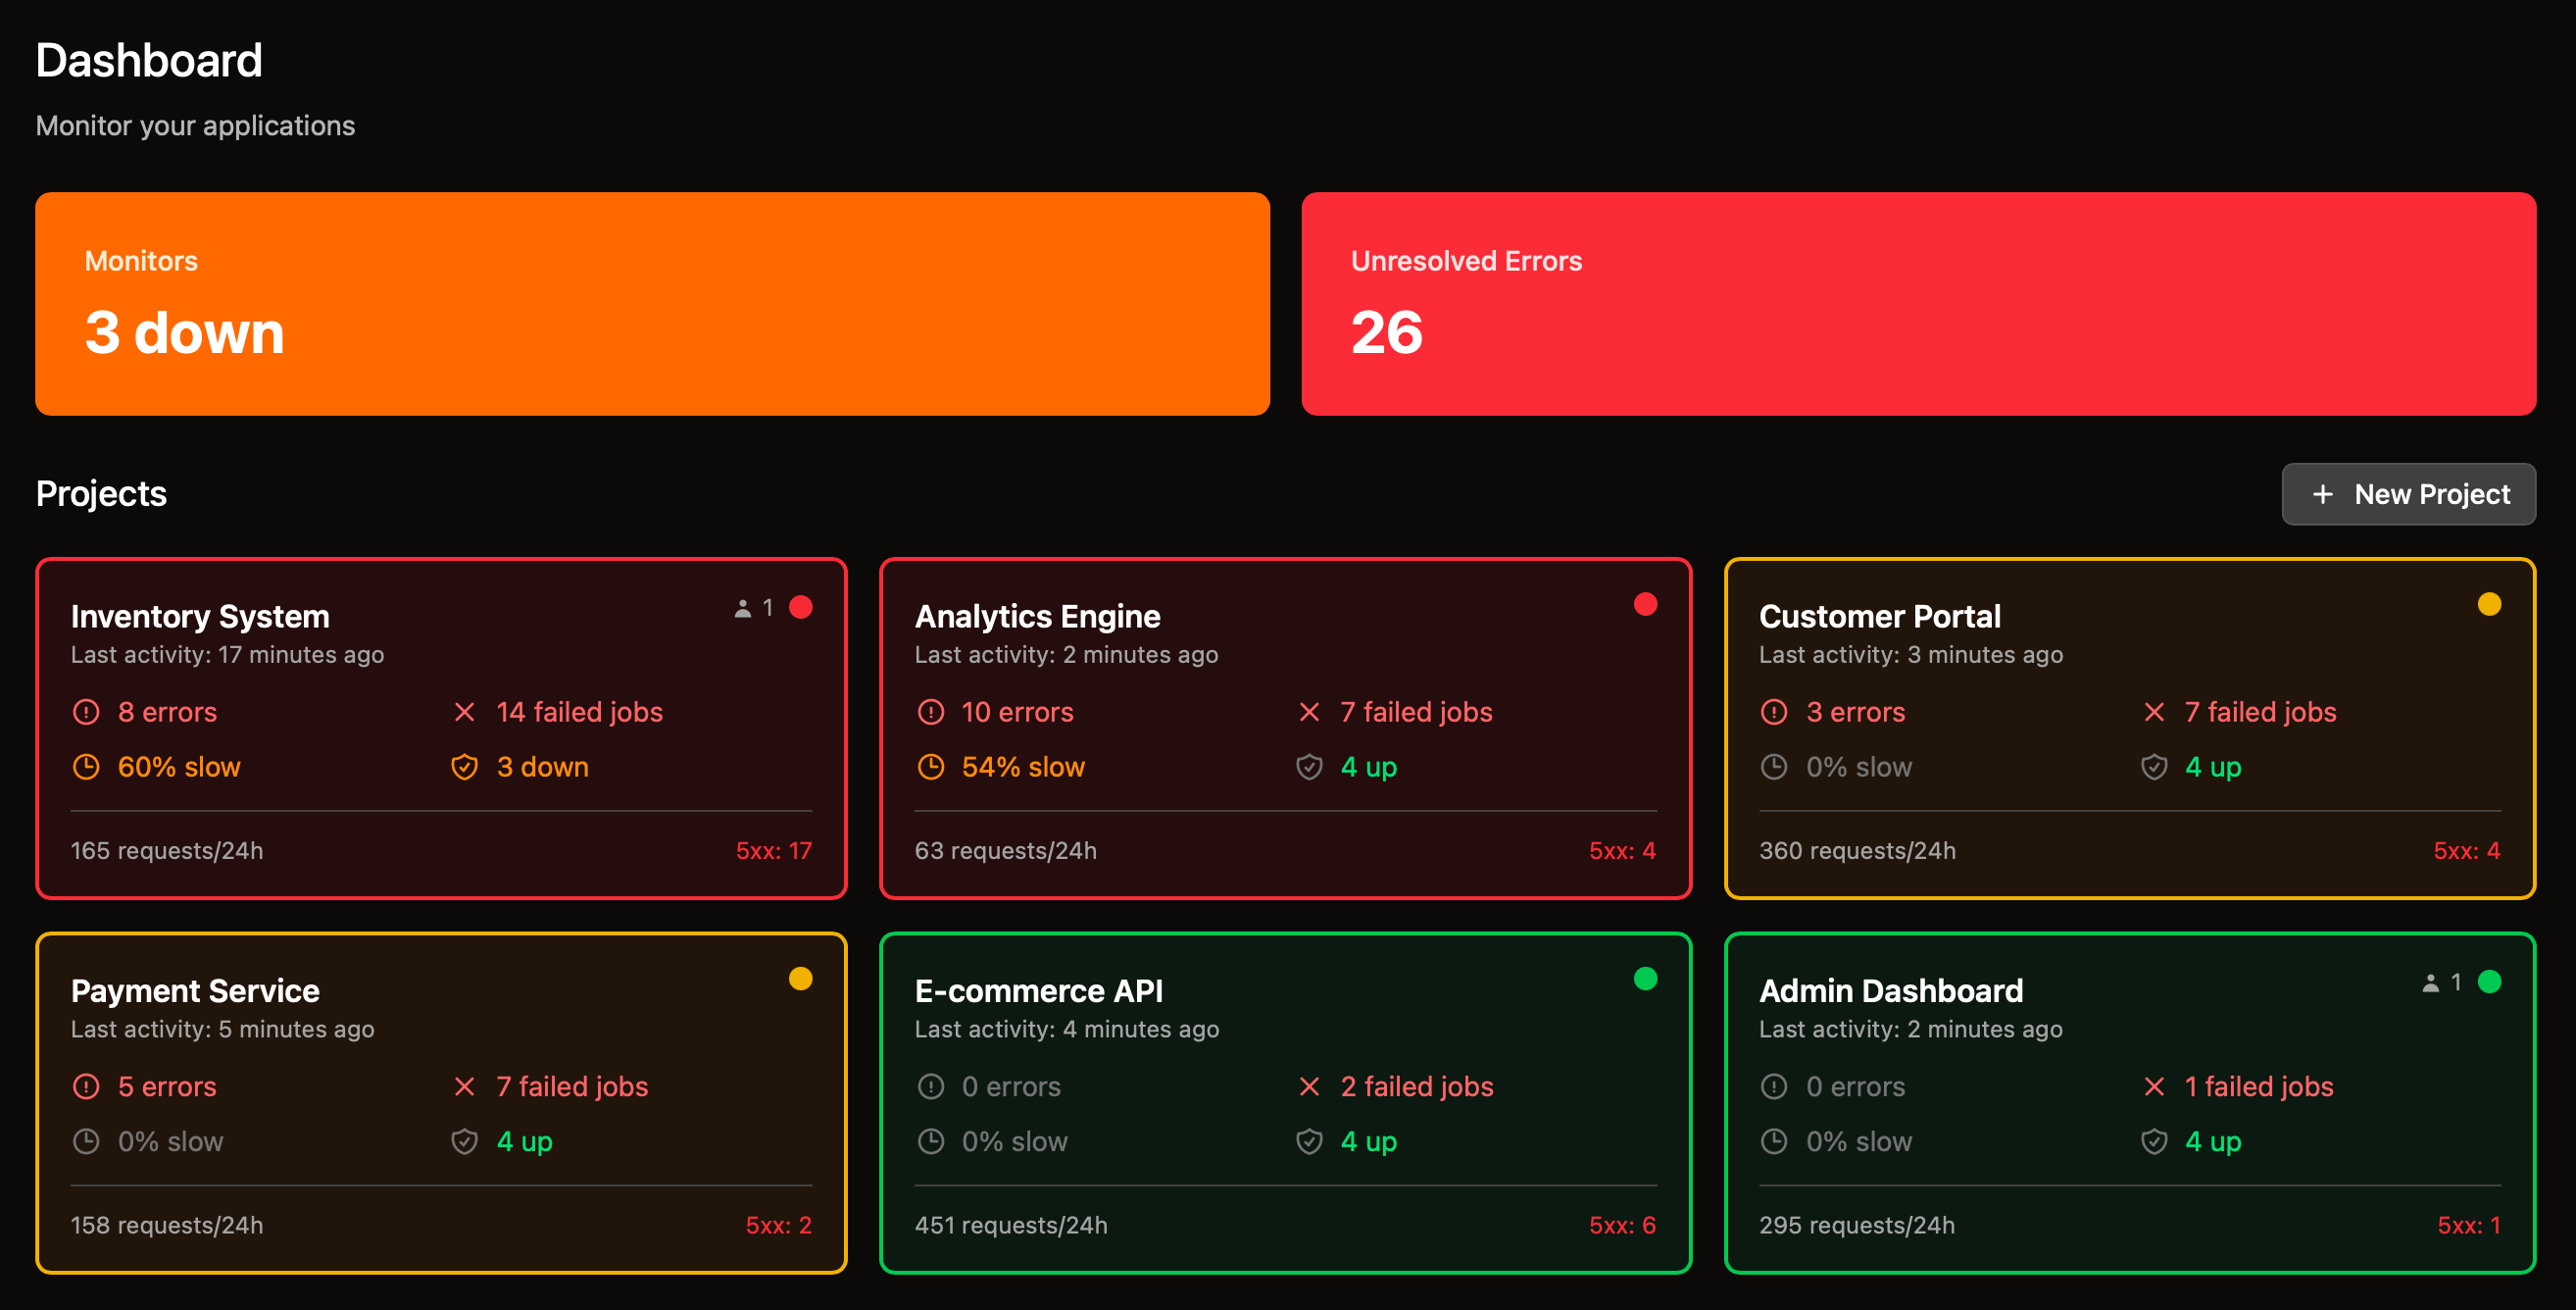
Project Overview
See the health of all your projects at a glance. The dashboard displays errors, requests, jobs, and other important metrics in real-time. Instantly spot when something needs your attention.
- Aggregated statistics across all projects
- Real-time updates every 30 seconds
- Quick access to critical issues
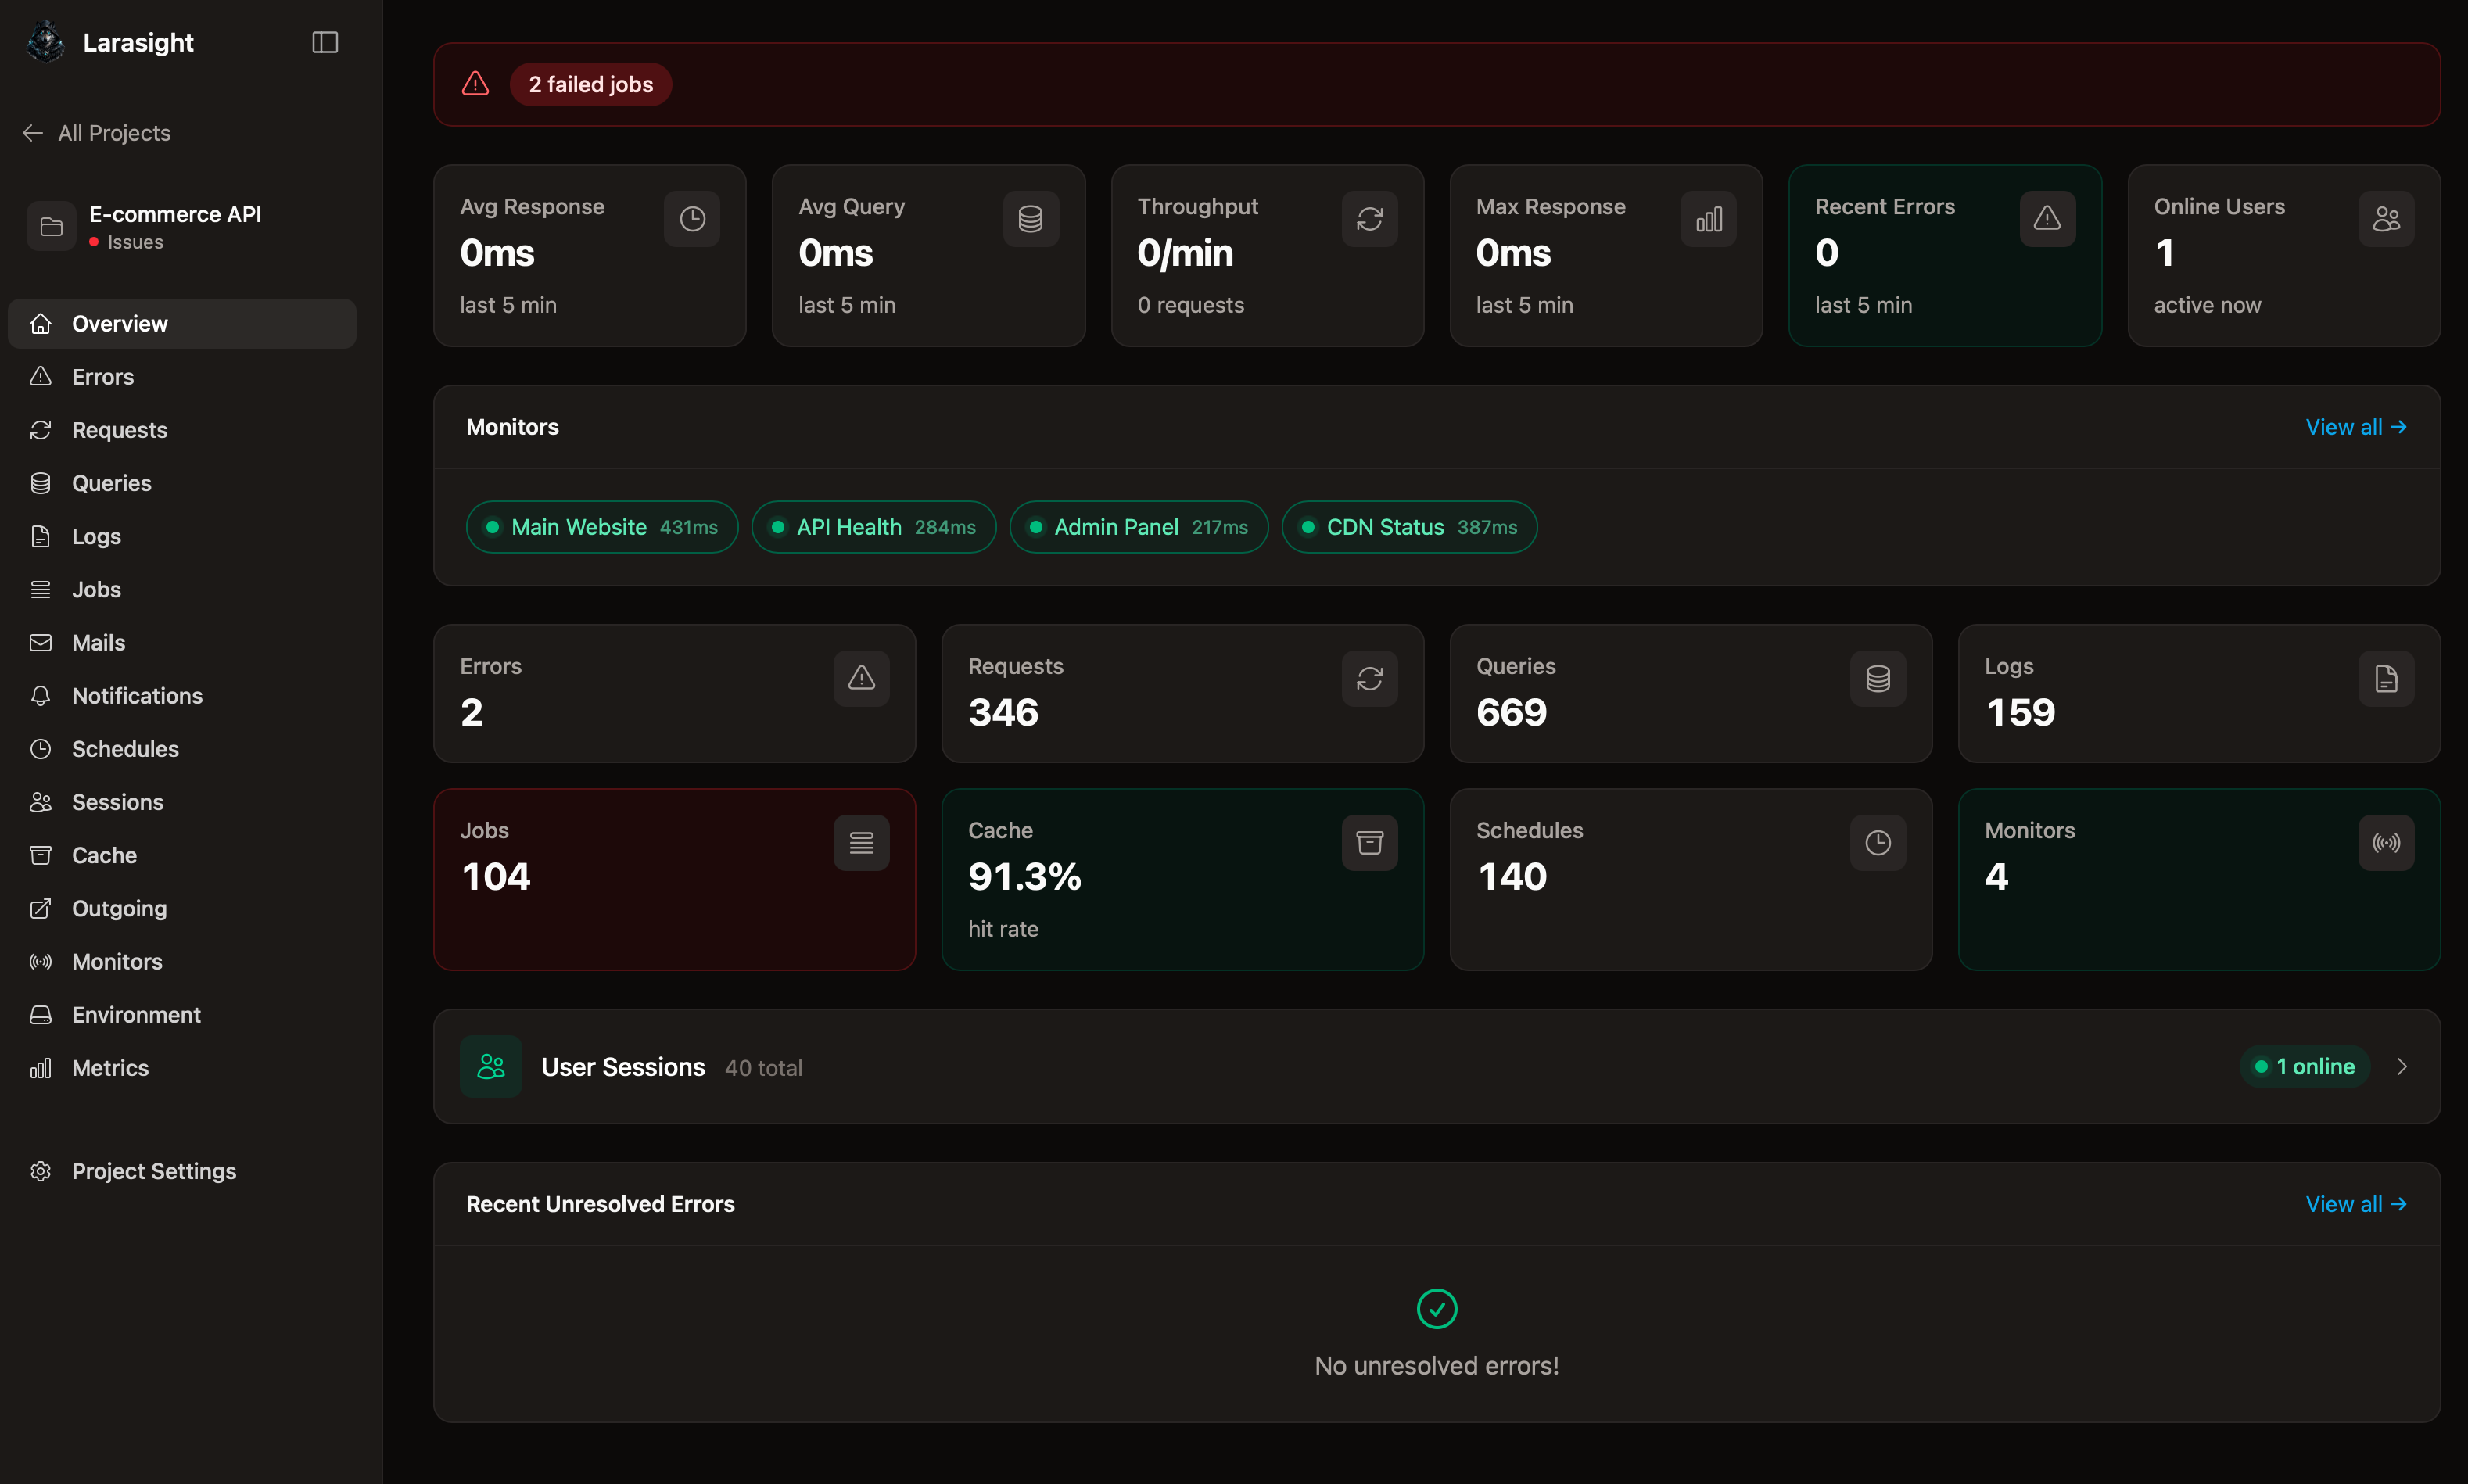
Project-level dashboard with detailed metrics
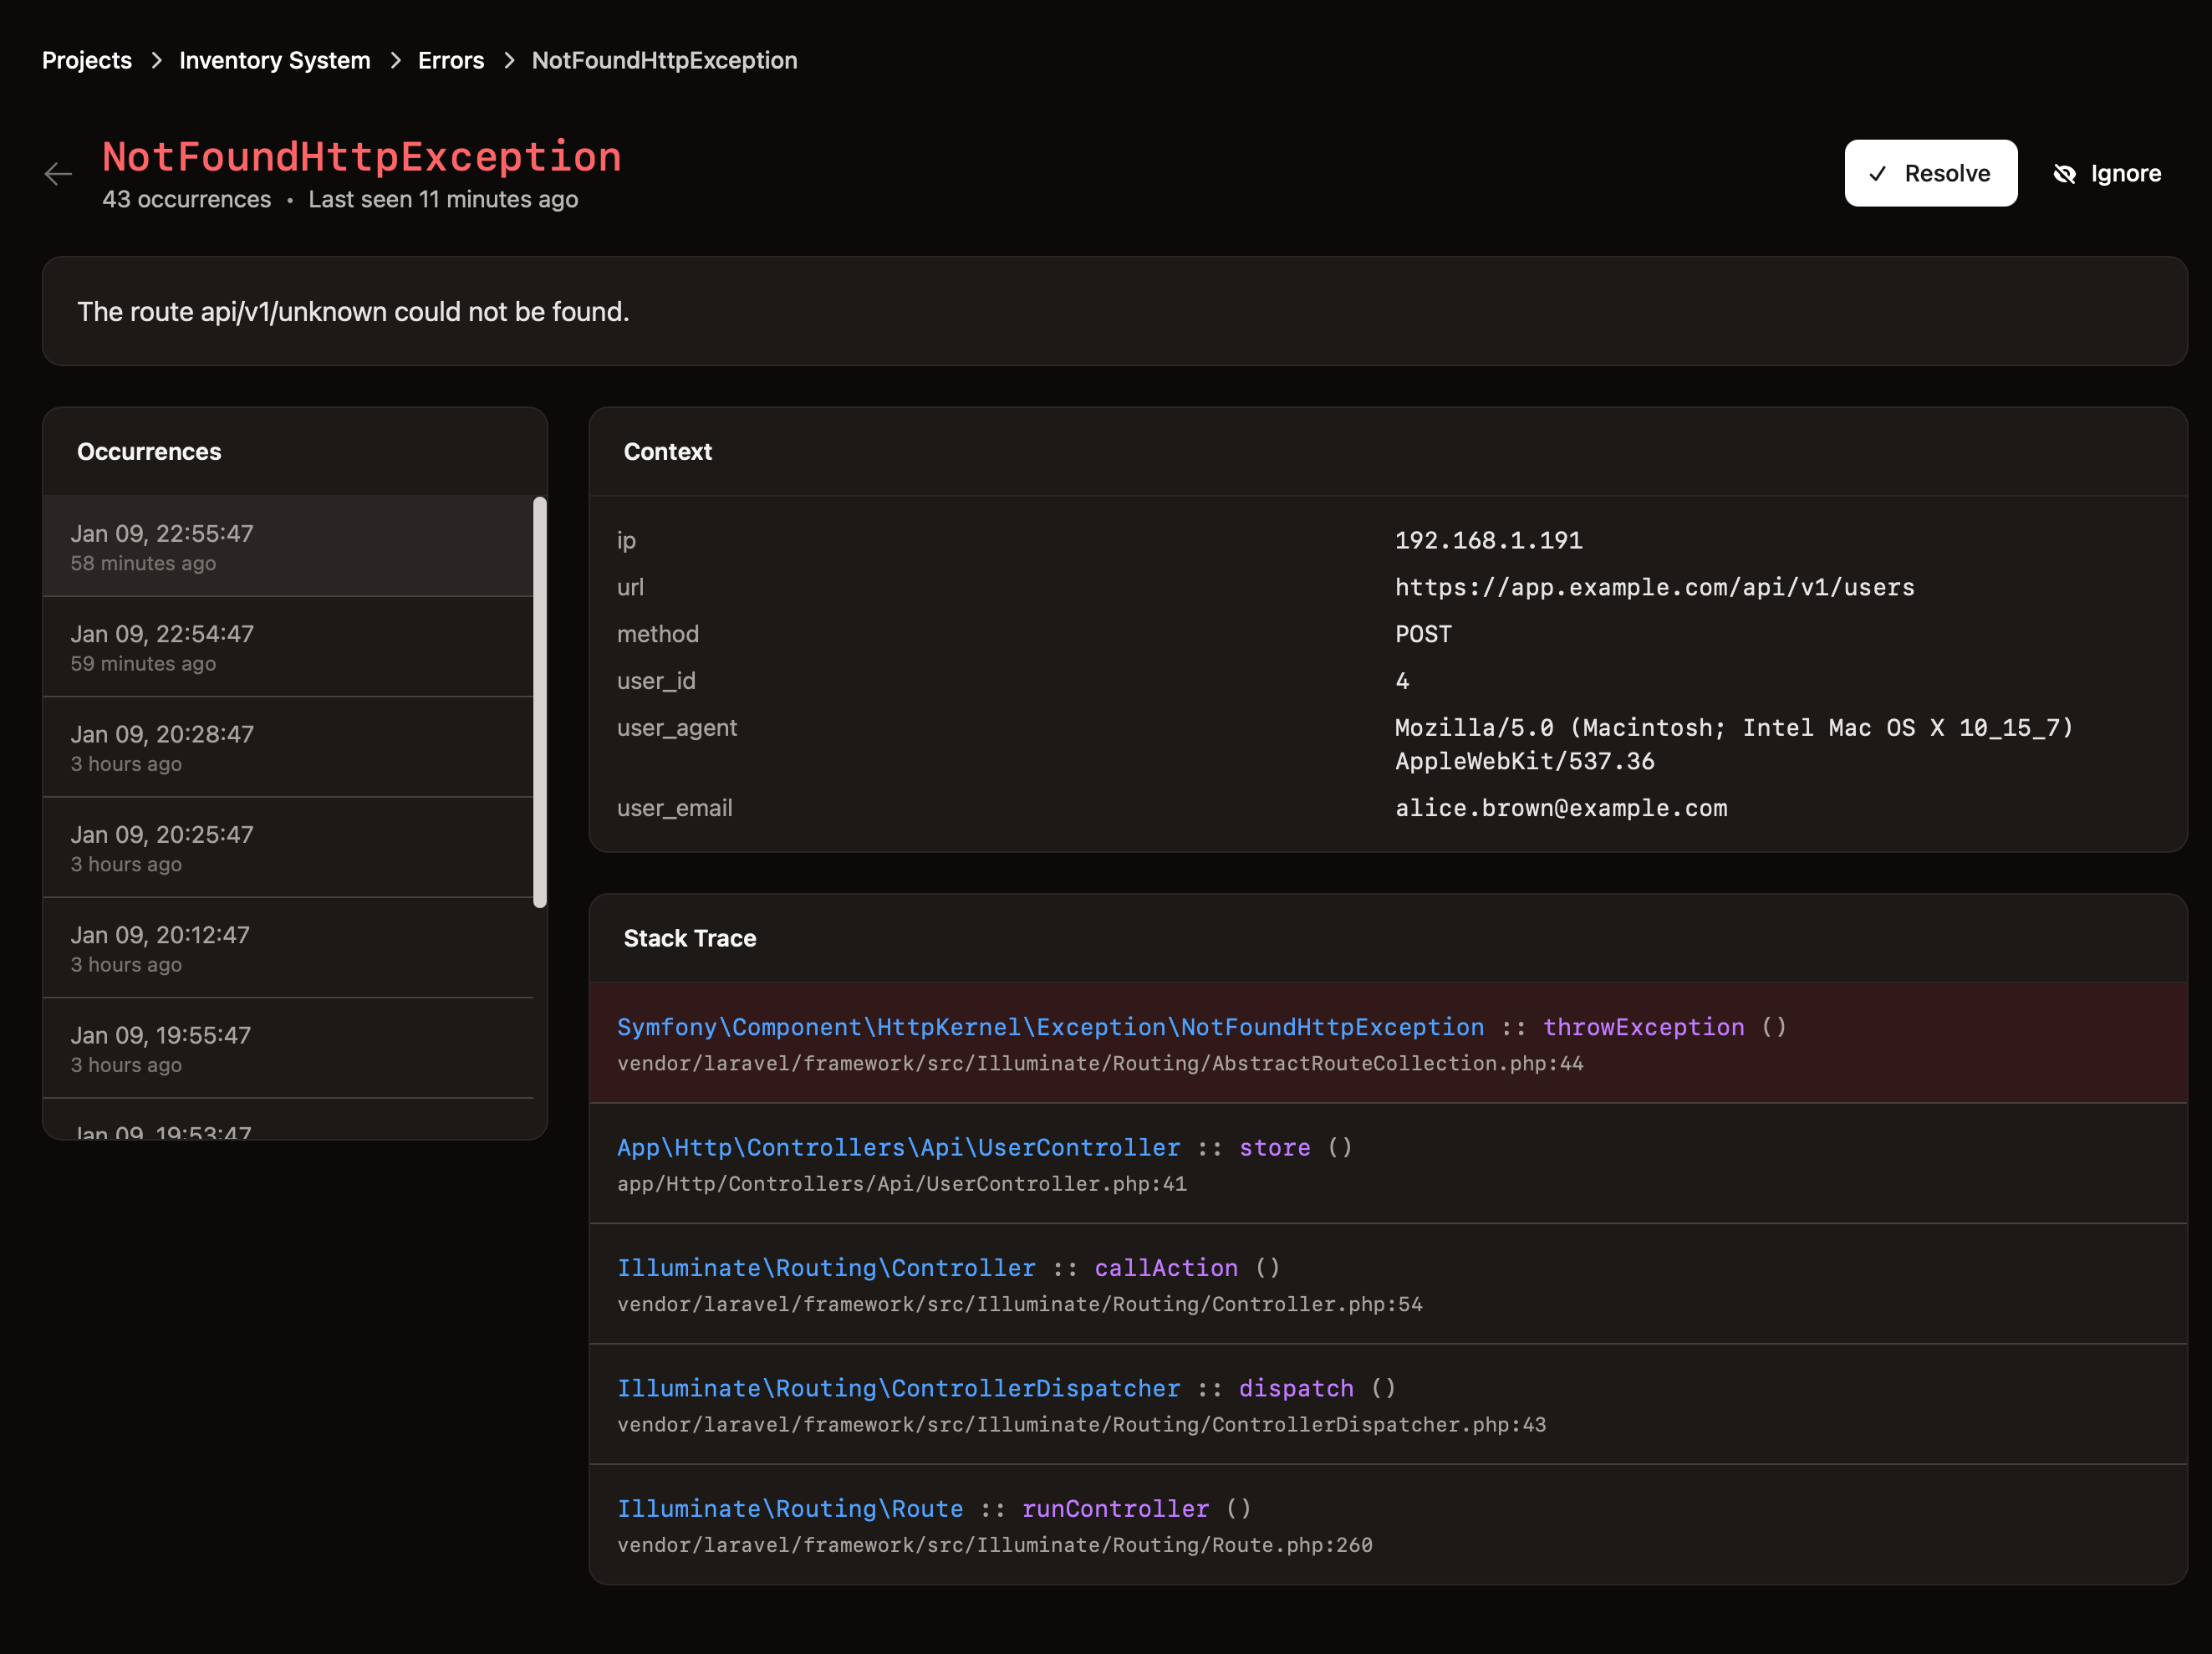
Detailed error view with stack trace and context
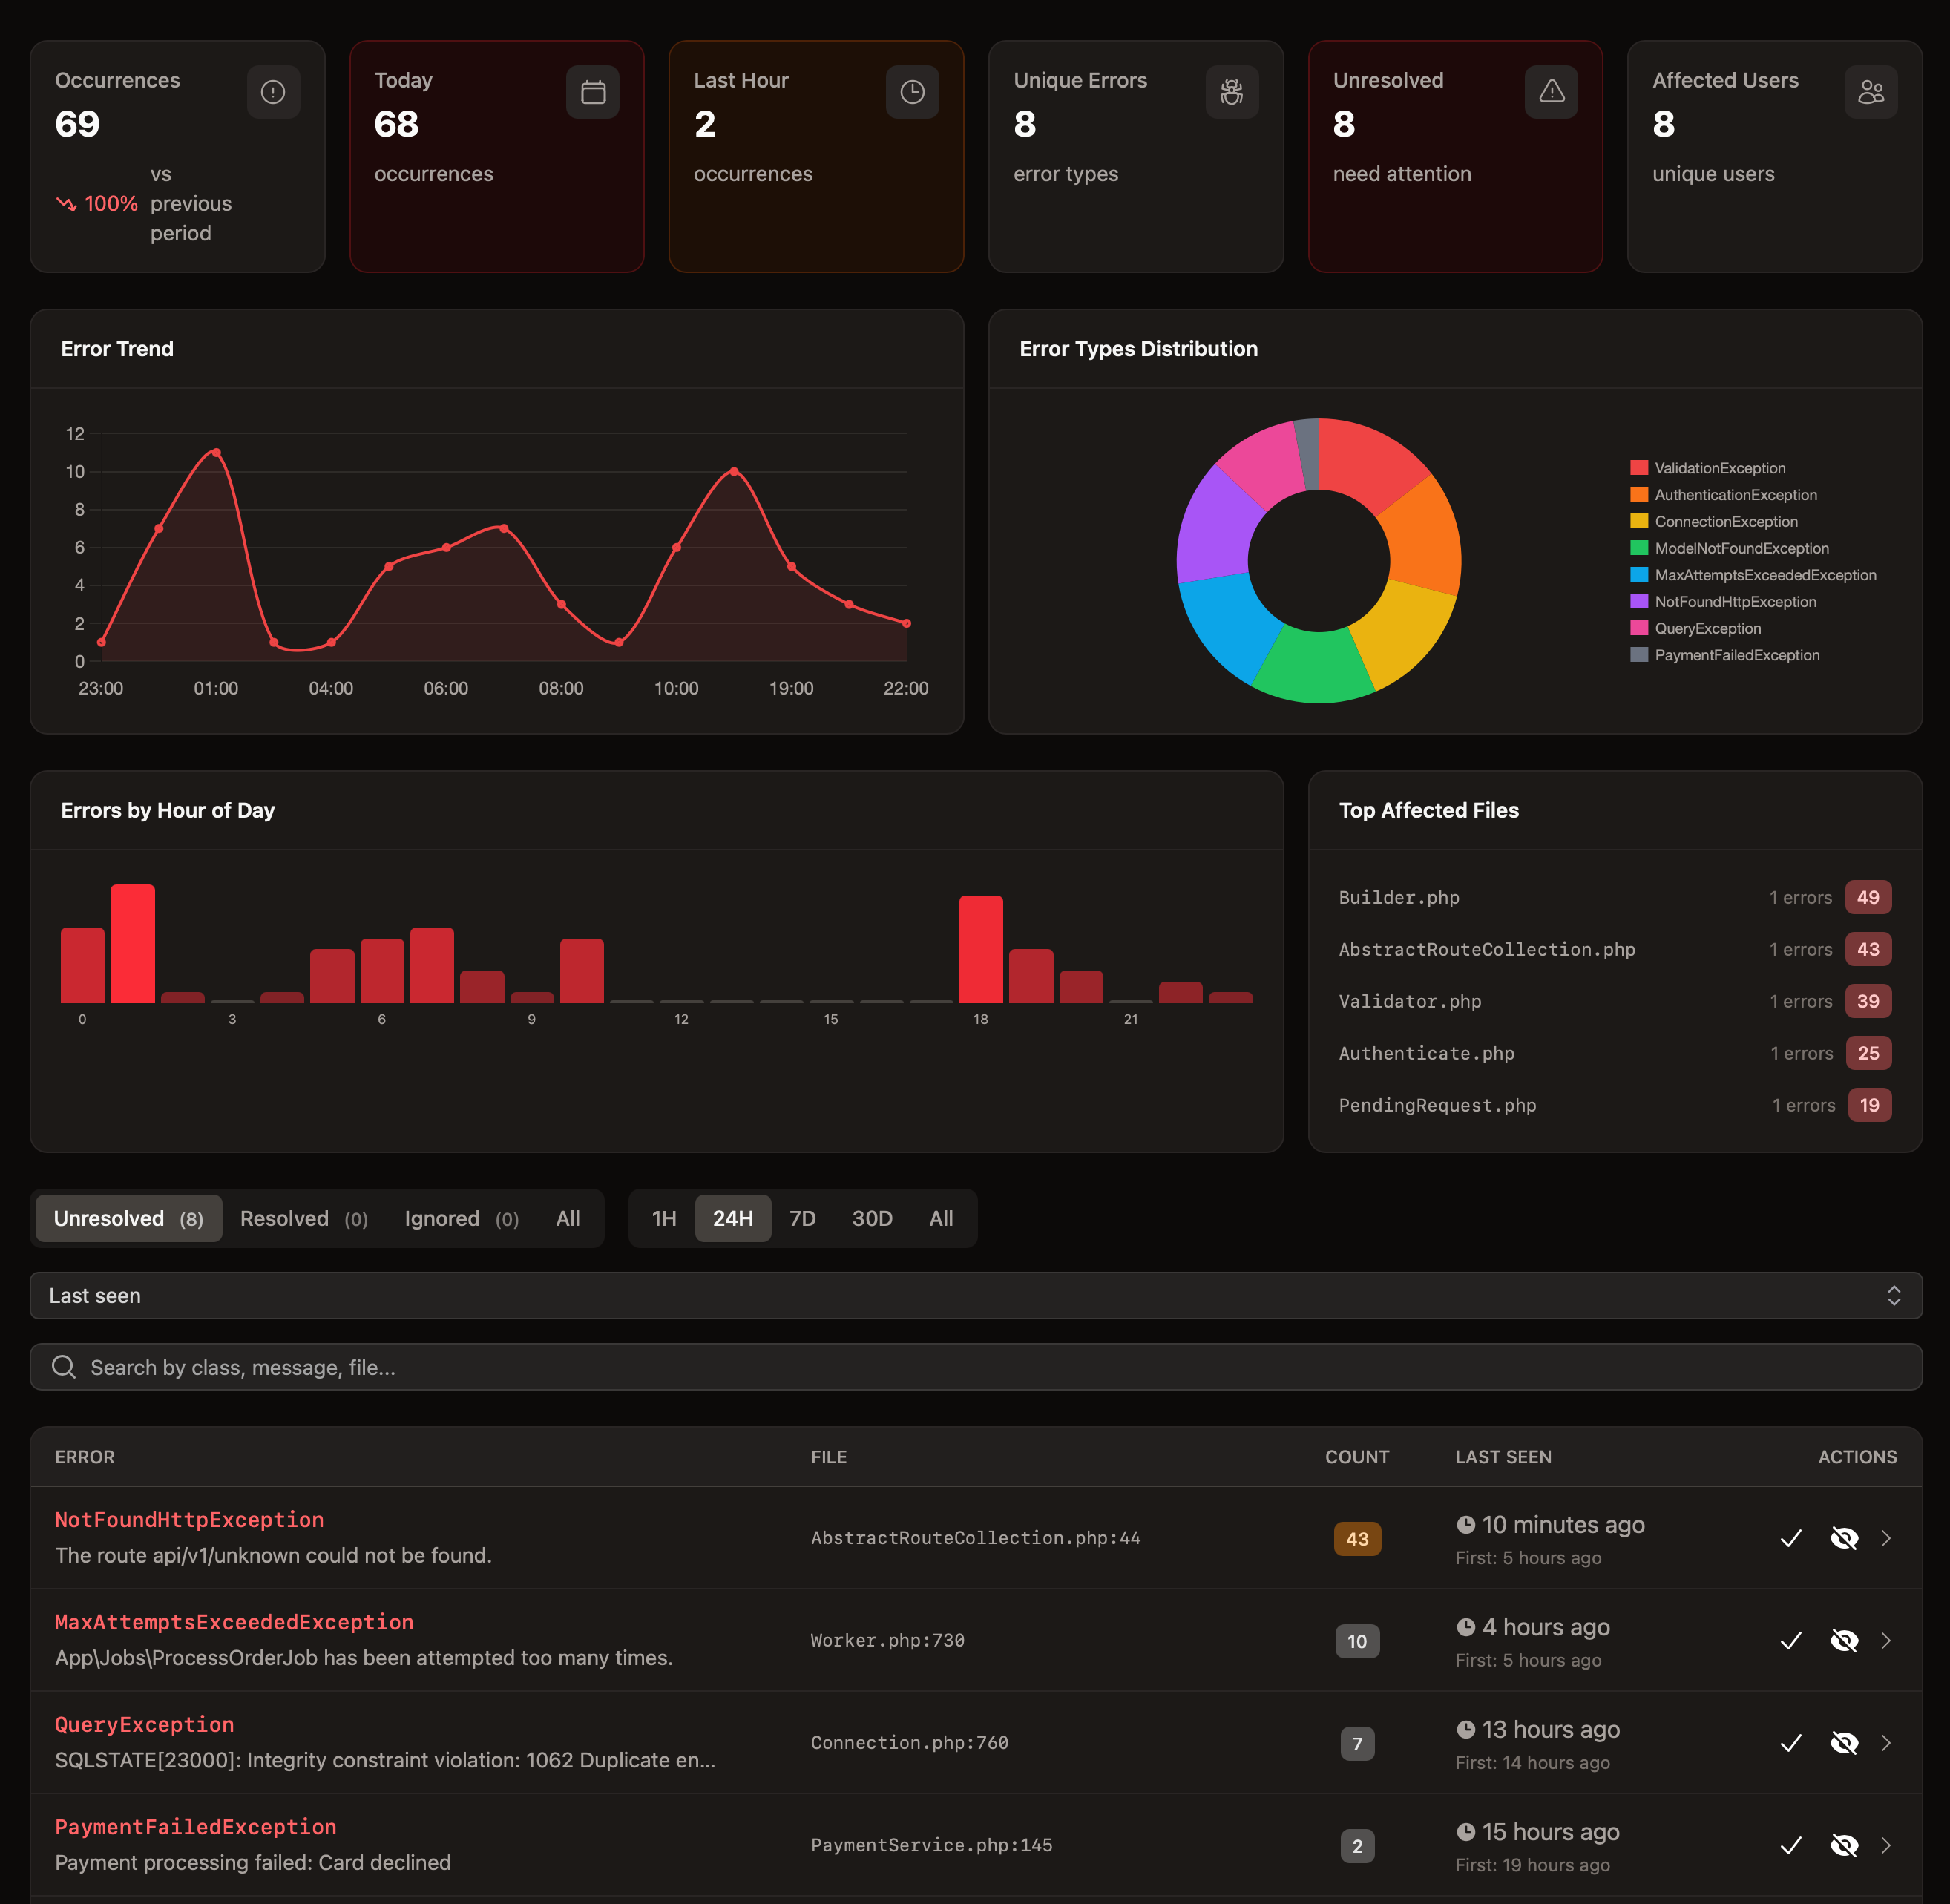
Exception Monitoring
Larasight automatically groups similar errors so you don't have to review the same exception hundreds of times. Every error includes the full stack trace, request context, and user information.
- Intelligent error grouping by fingerprint
- Full stack trace and request context
- Status management: resolved, ignored
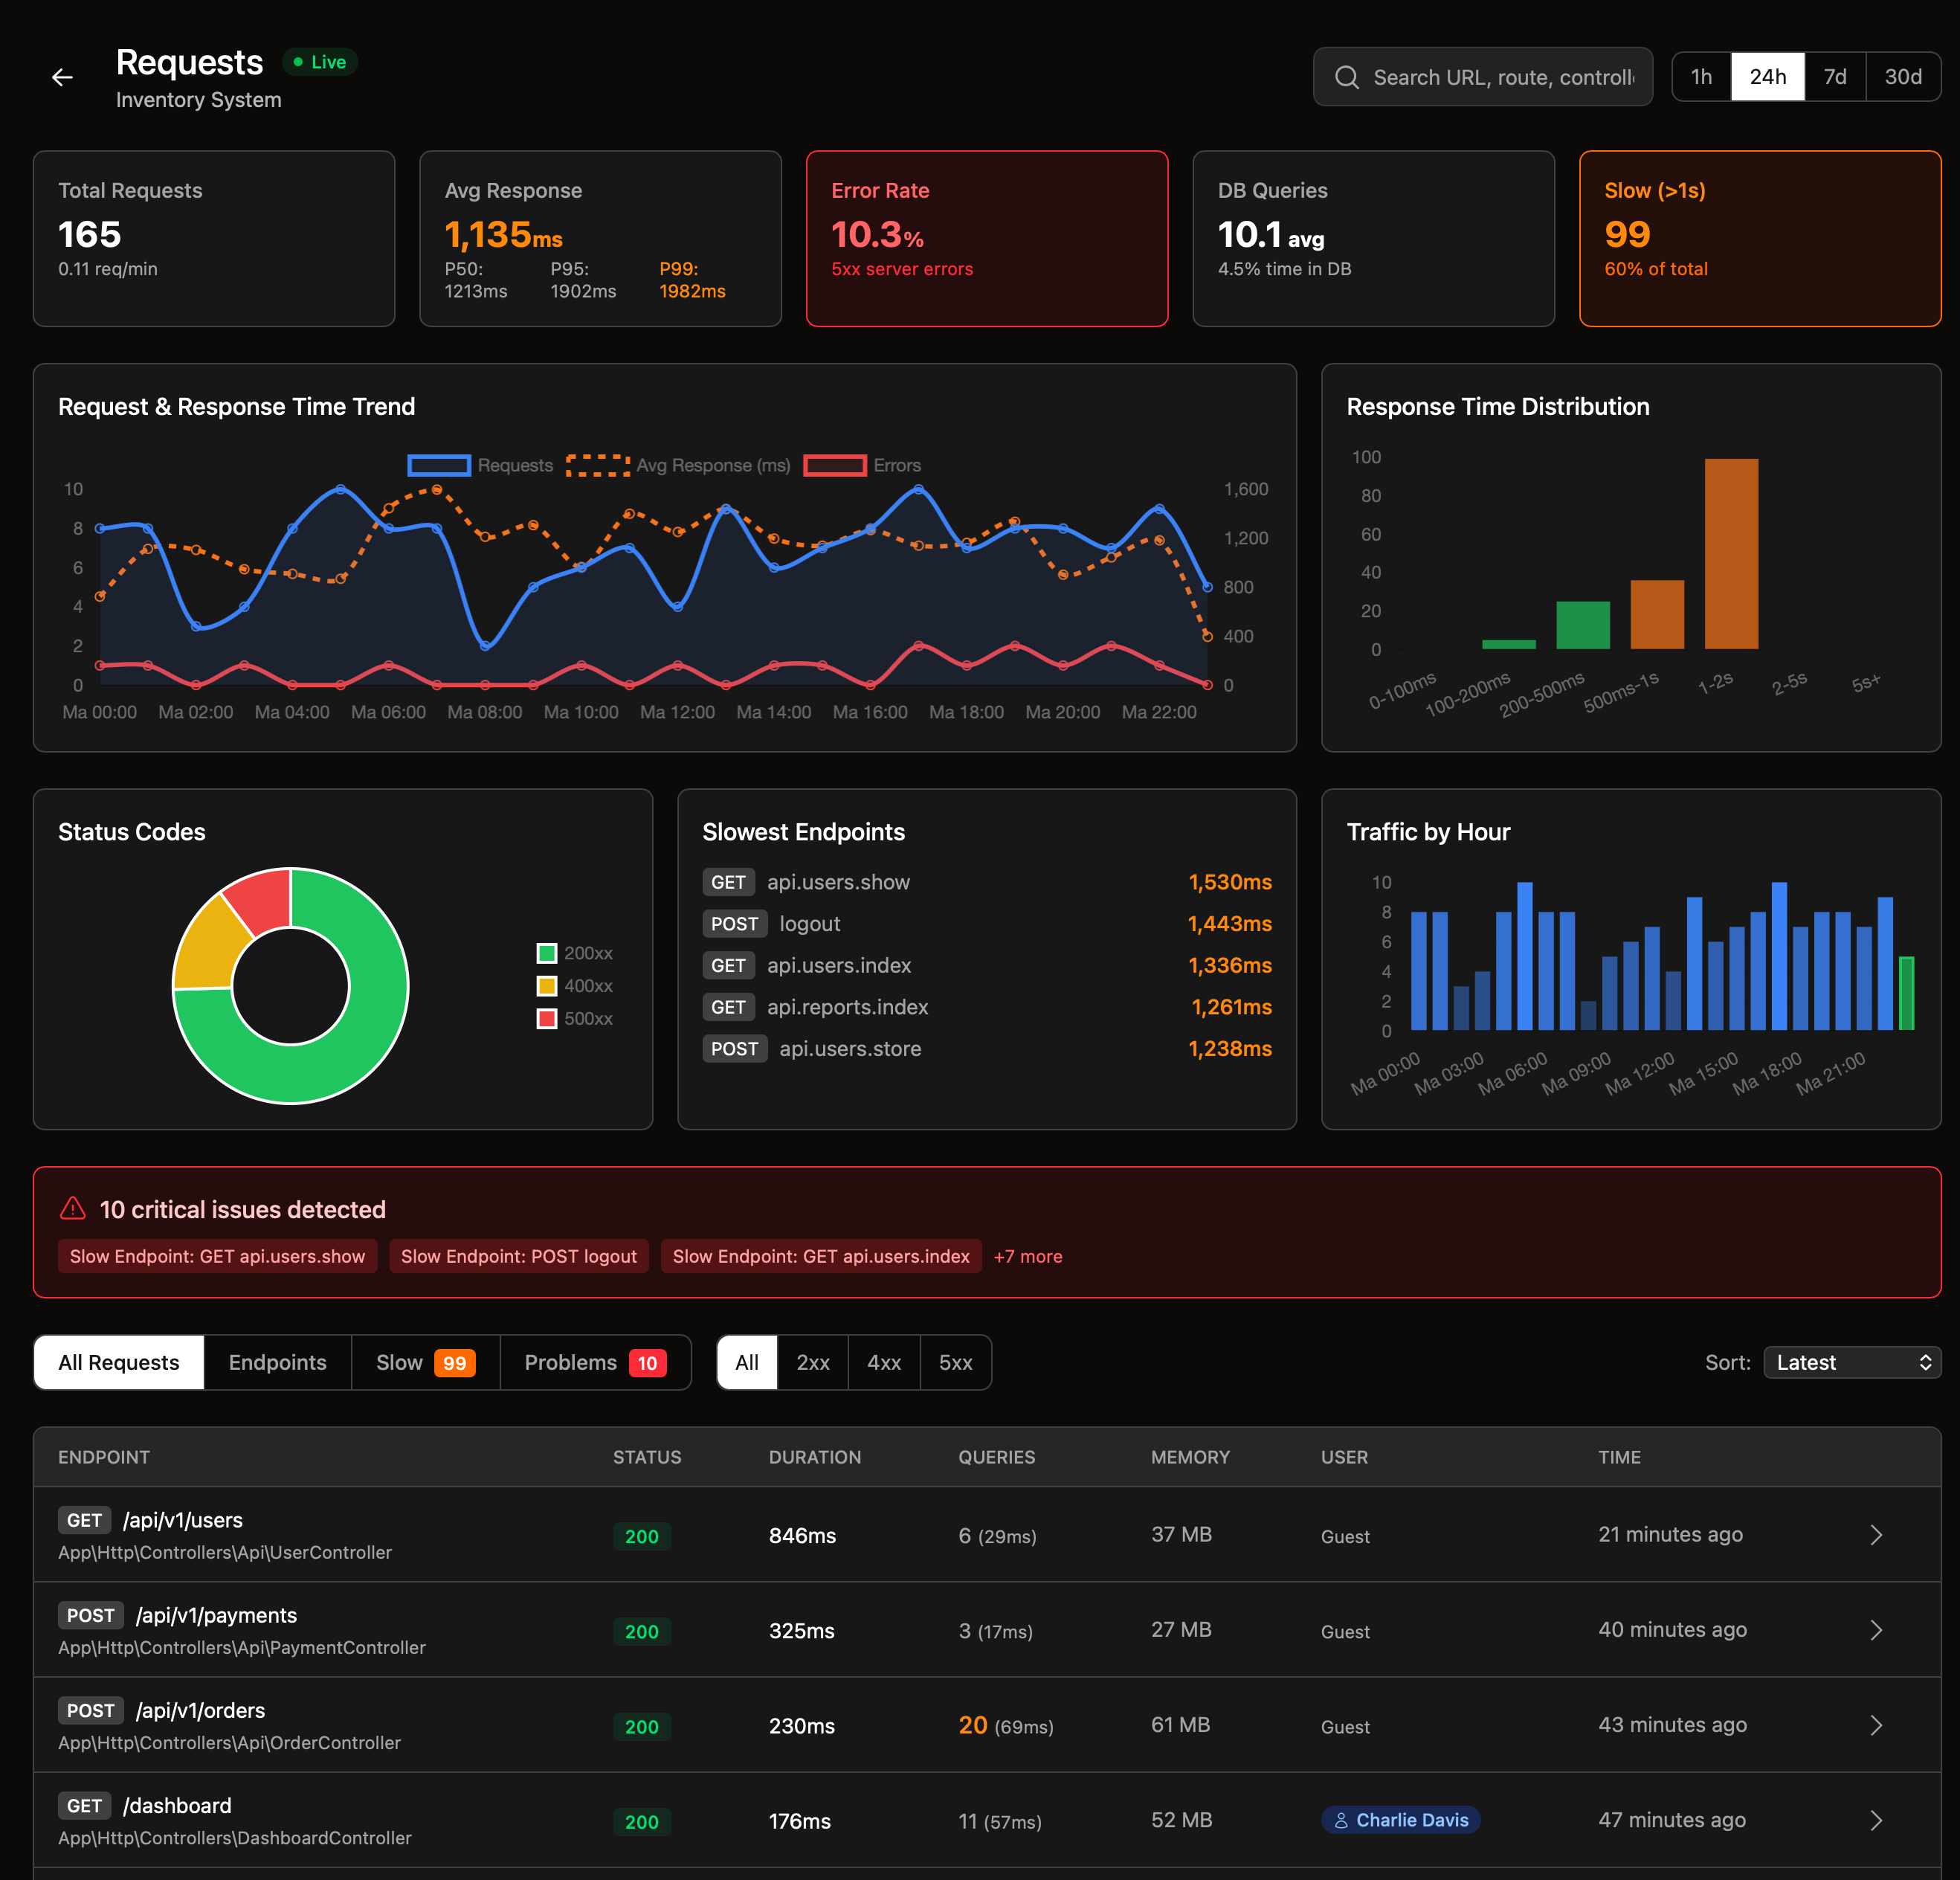
HTTP Request Analysis
Track every HTTP request hitting your application. See response times, status codes, controllers, and associated queries. The visual timeline shows exactly what happened during each request - queries, views, cache operations, and events - all on a zoomable, interactive timeline.
- Visual request timeline with zoom and cursor
- Lifecycle stages: boot, middleware, controller, view
- N+1 query detection per request
- User session and memory tracking
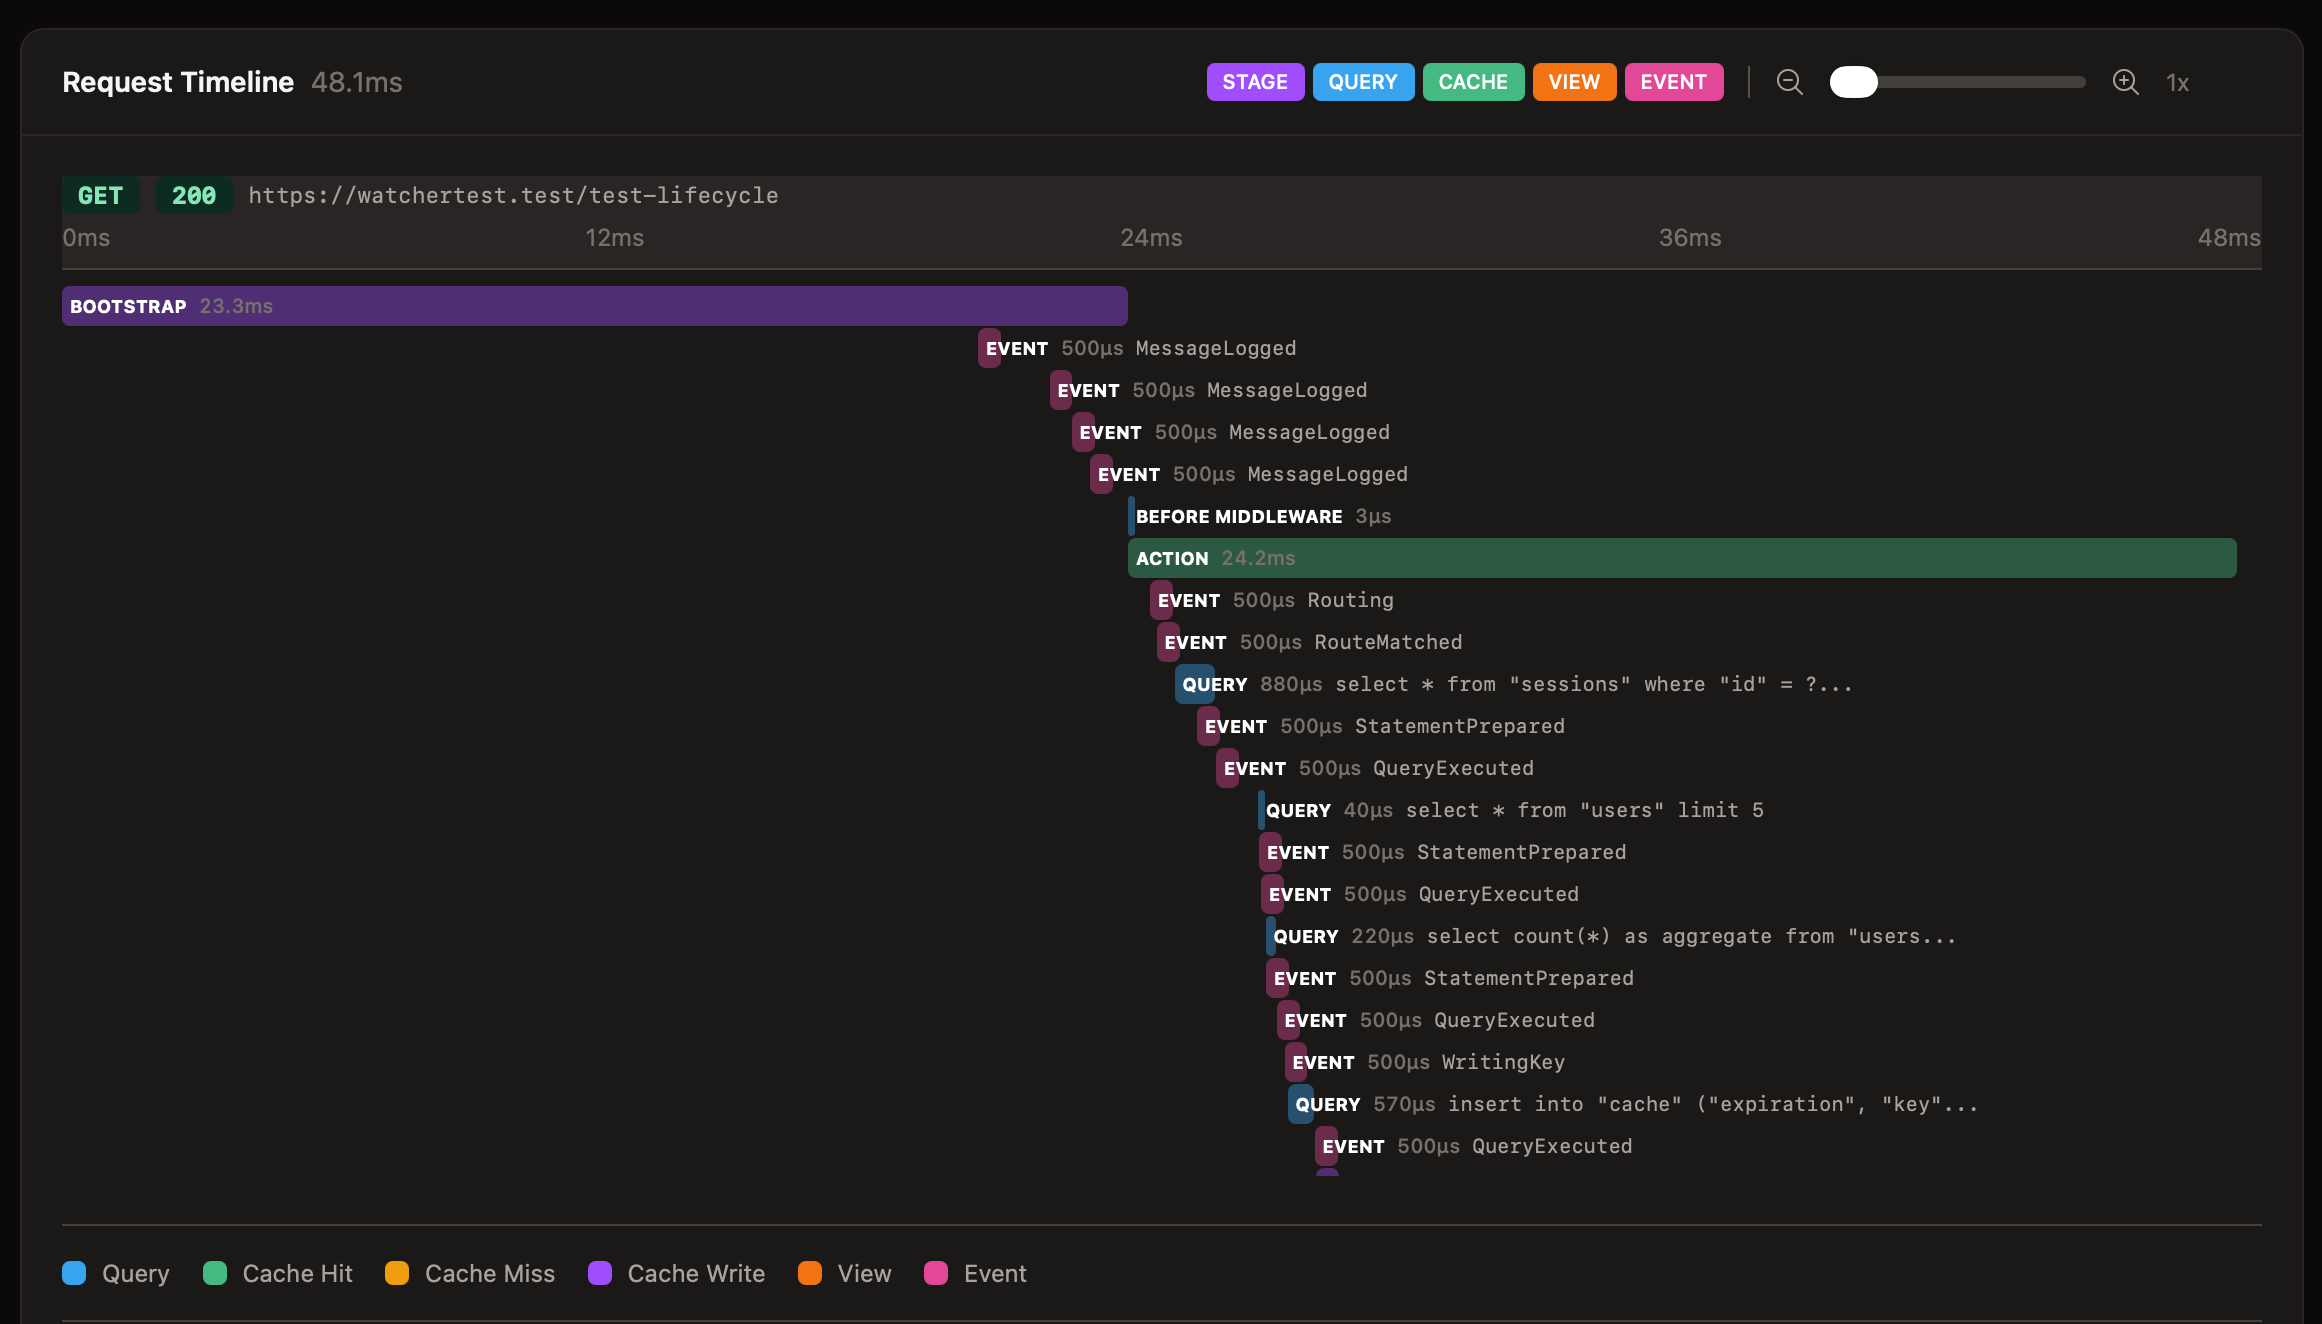
Interactive timeline showing queries, views, cache and events
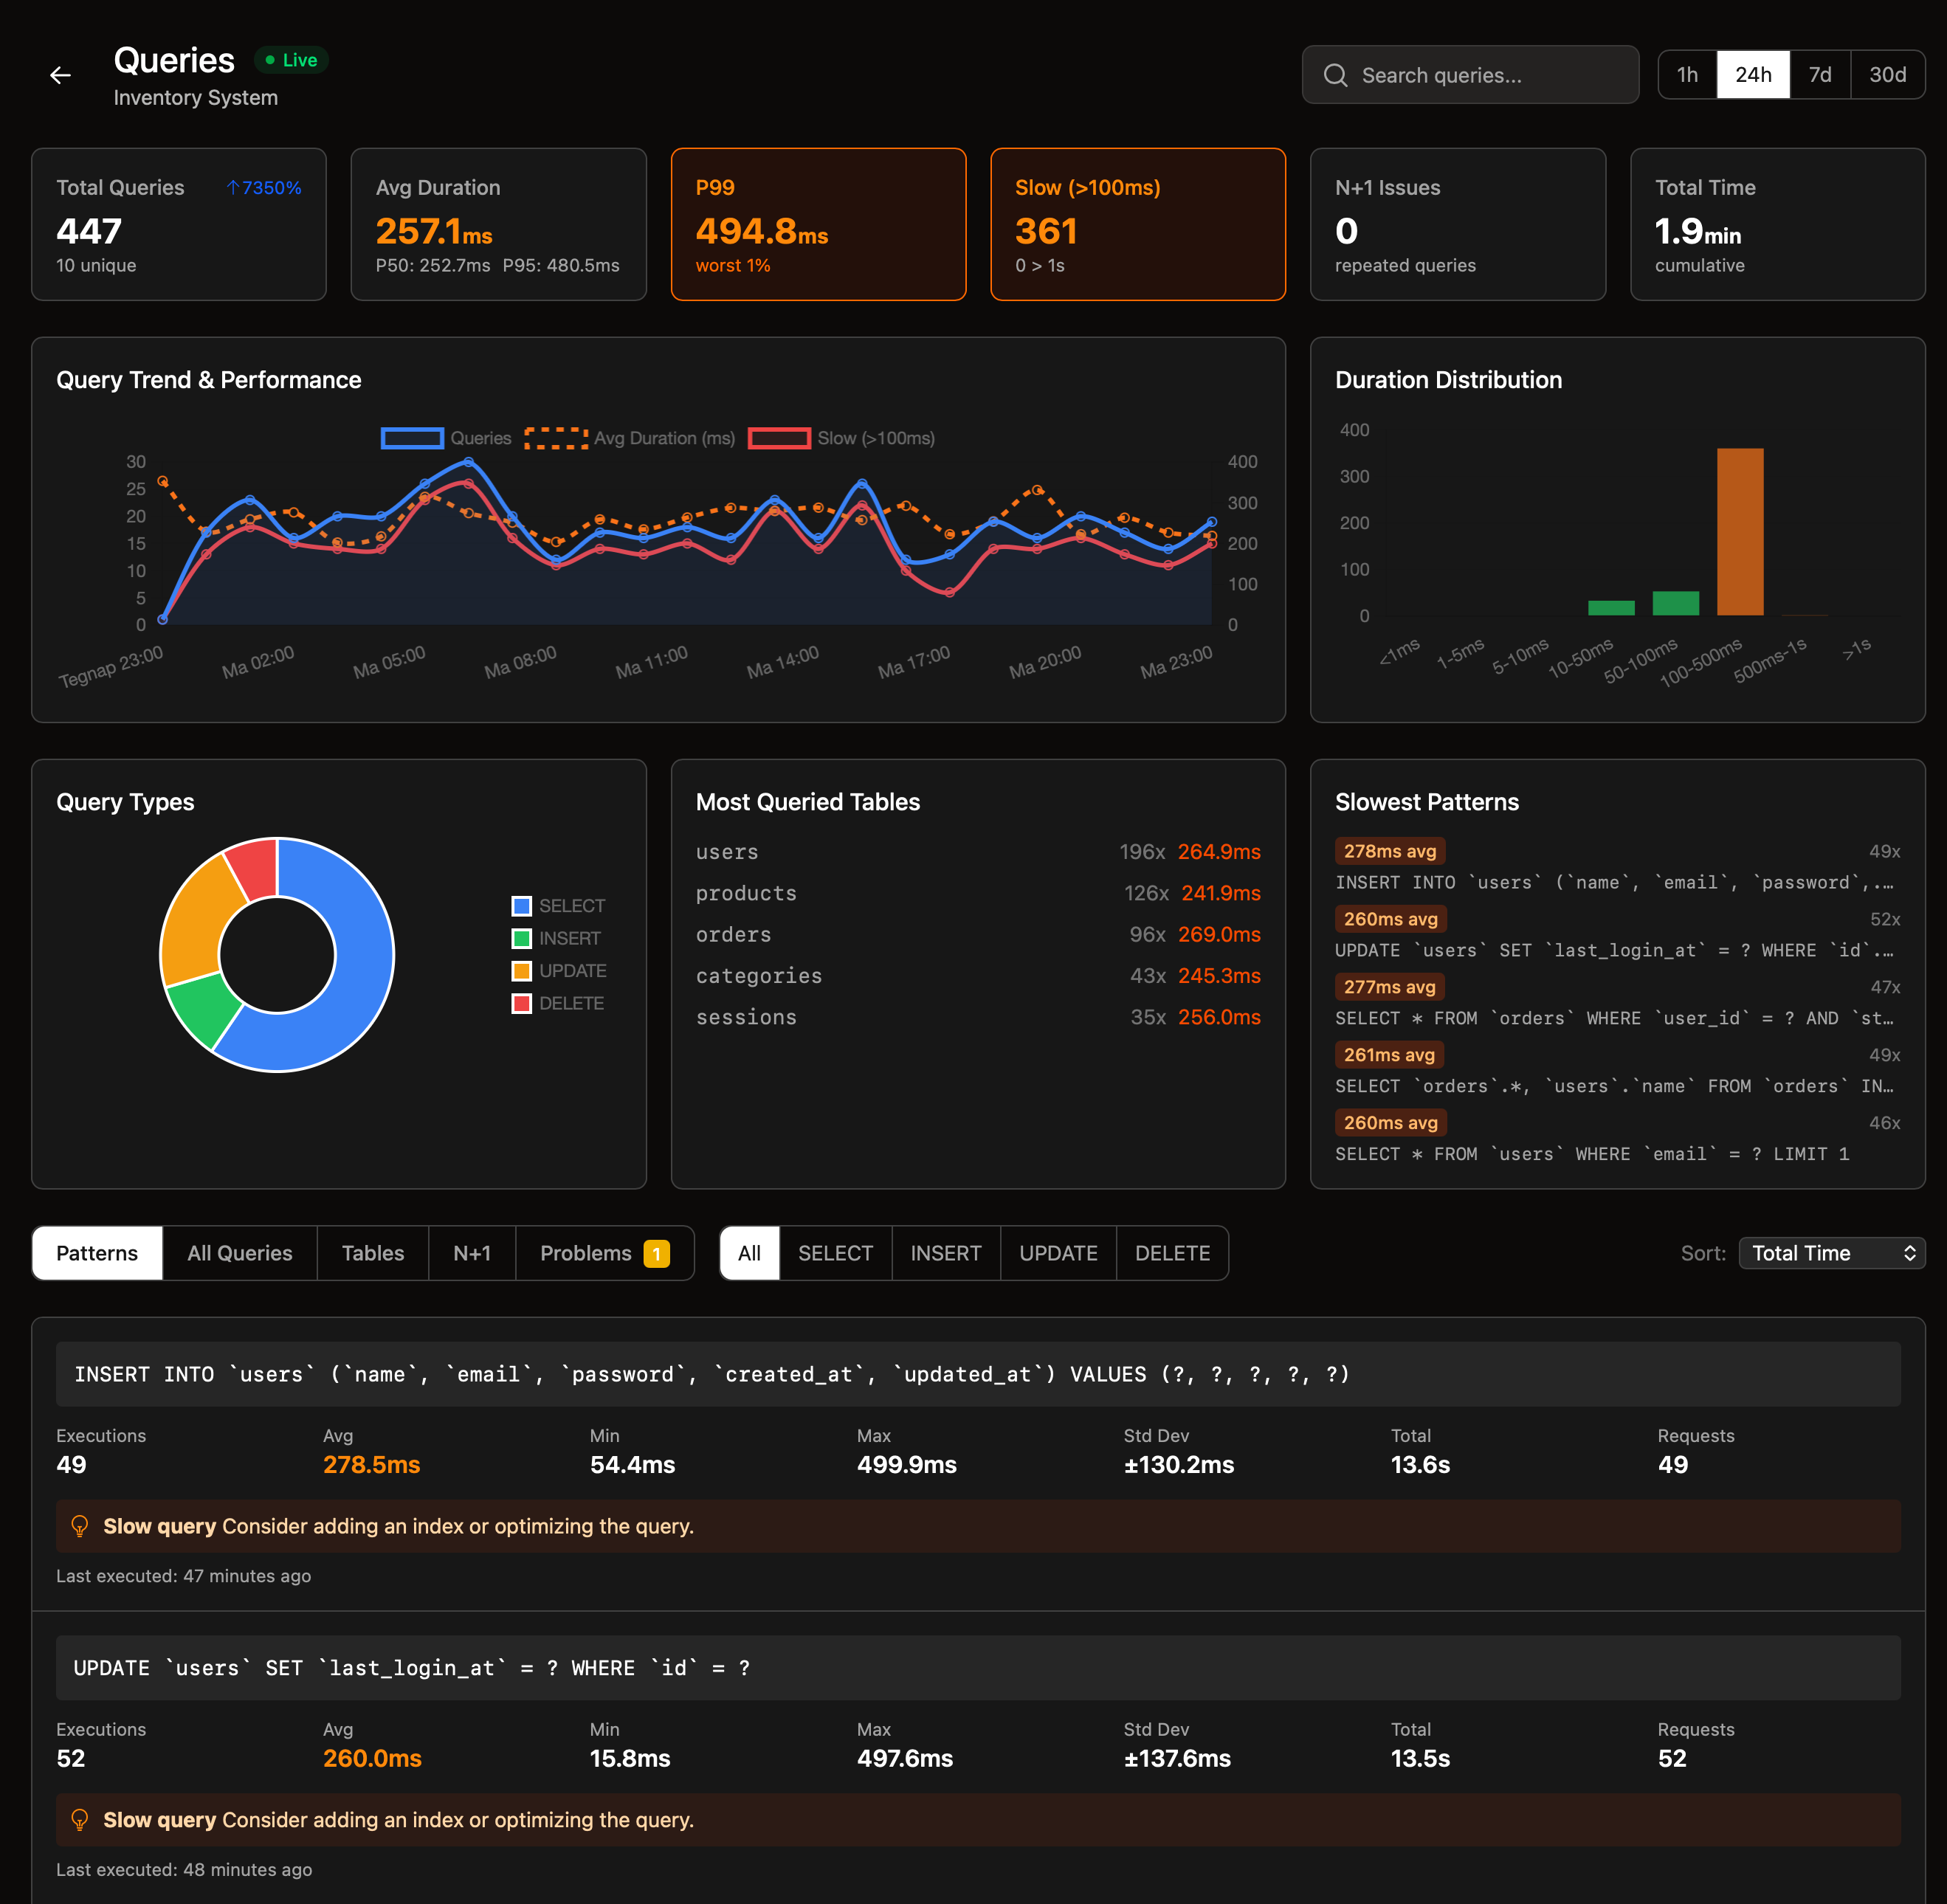
SQL Query Insights
Analyze every SQL query your application executes. Identify slow queries, N+1 problems, and optimize your database performance. Every query is traceable back to the request that triggered it.
- Automatic slow query detection
- Normalized SQL with binding values
- Execution time statistics
Centralized Logging
Centralize all your Laravel logs in one place. Filter by level, channel, or time period. Quickly find relevant entries and trace them back to the original request.
- Filter by level: debug, info, warning, error
- Channel-based categorization
- Context and extra data display
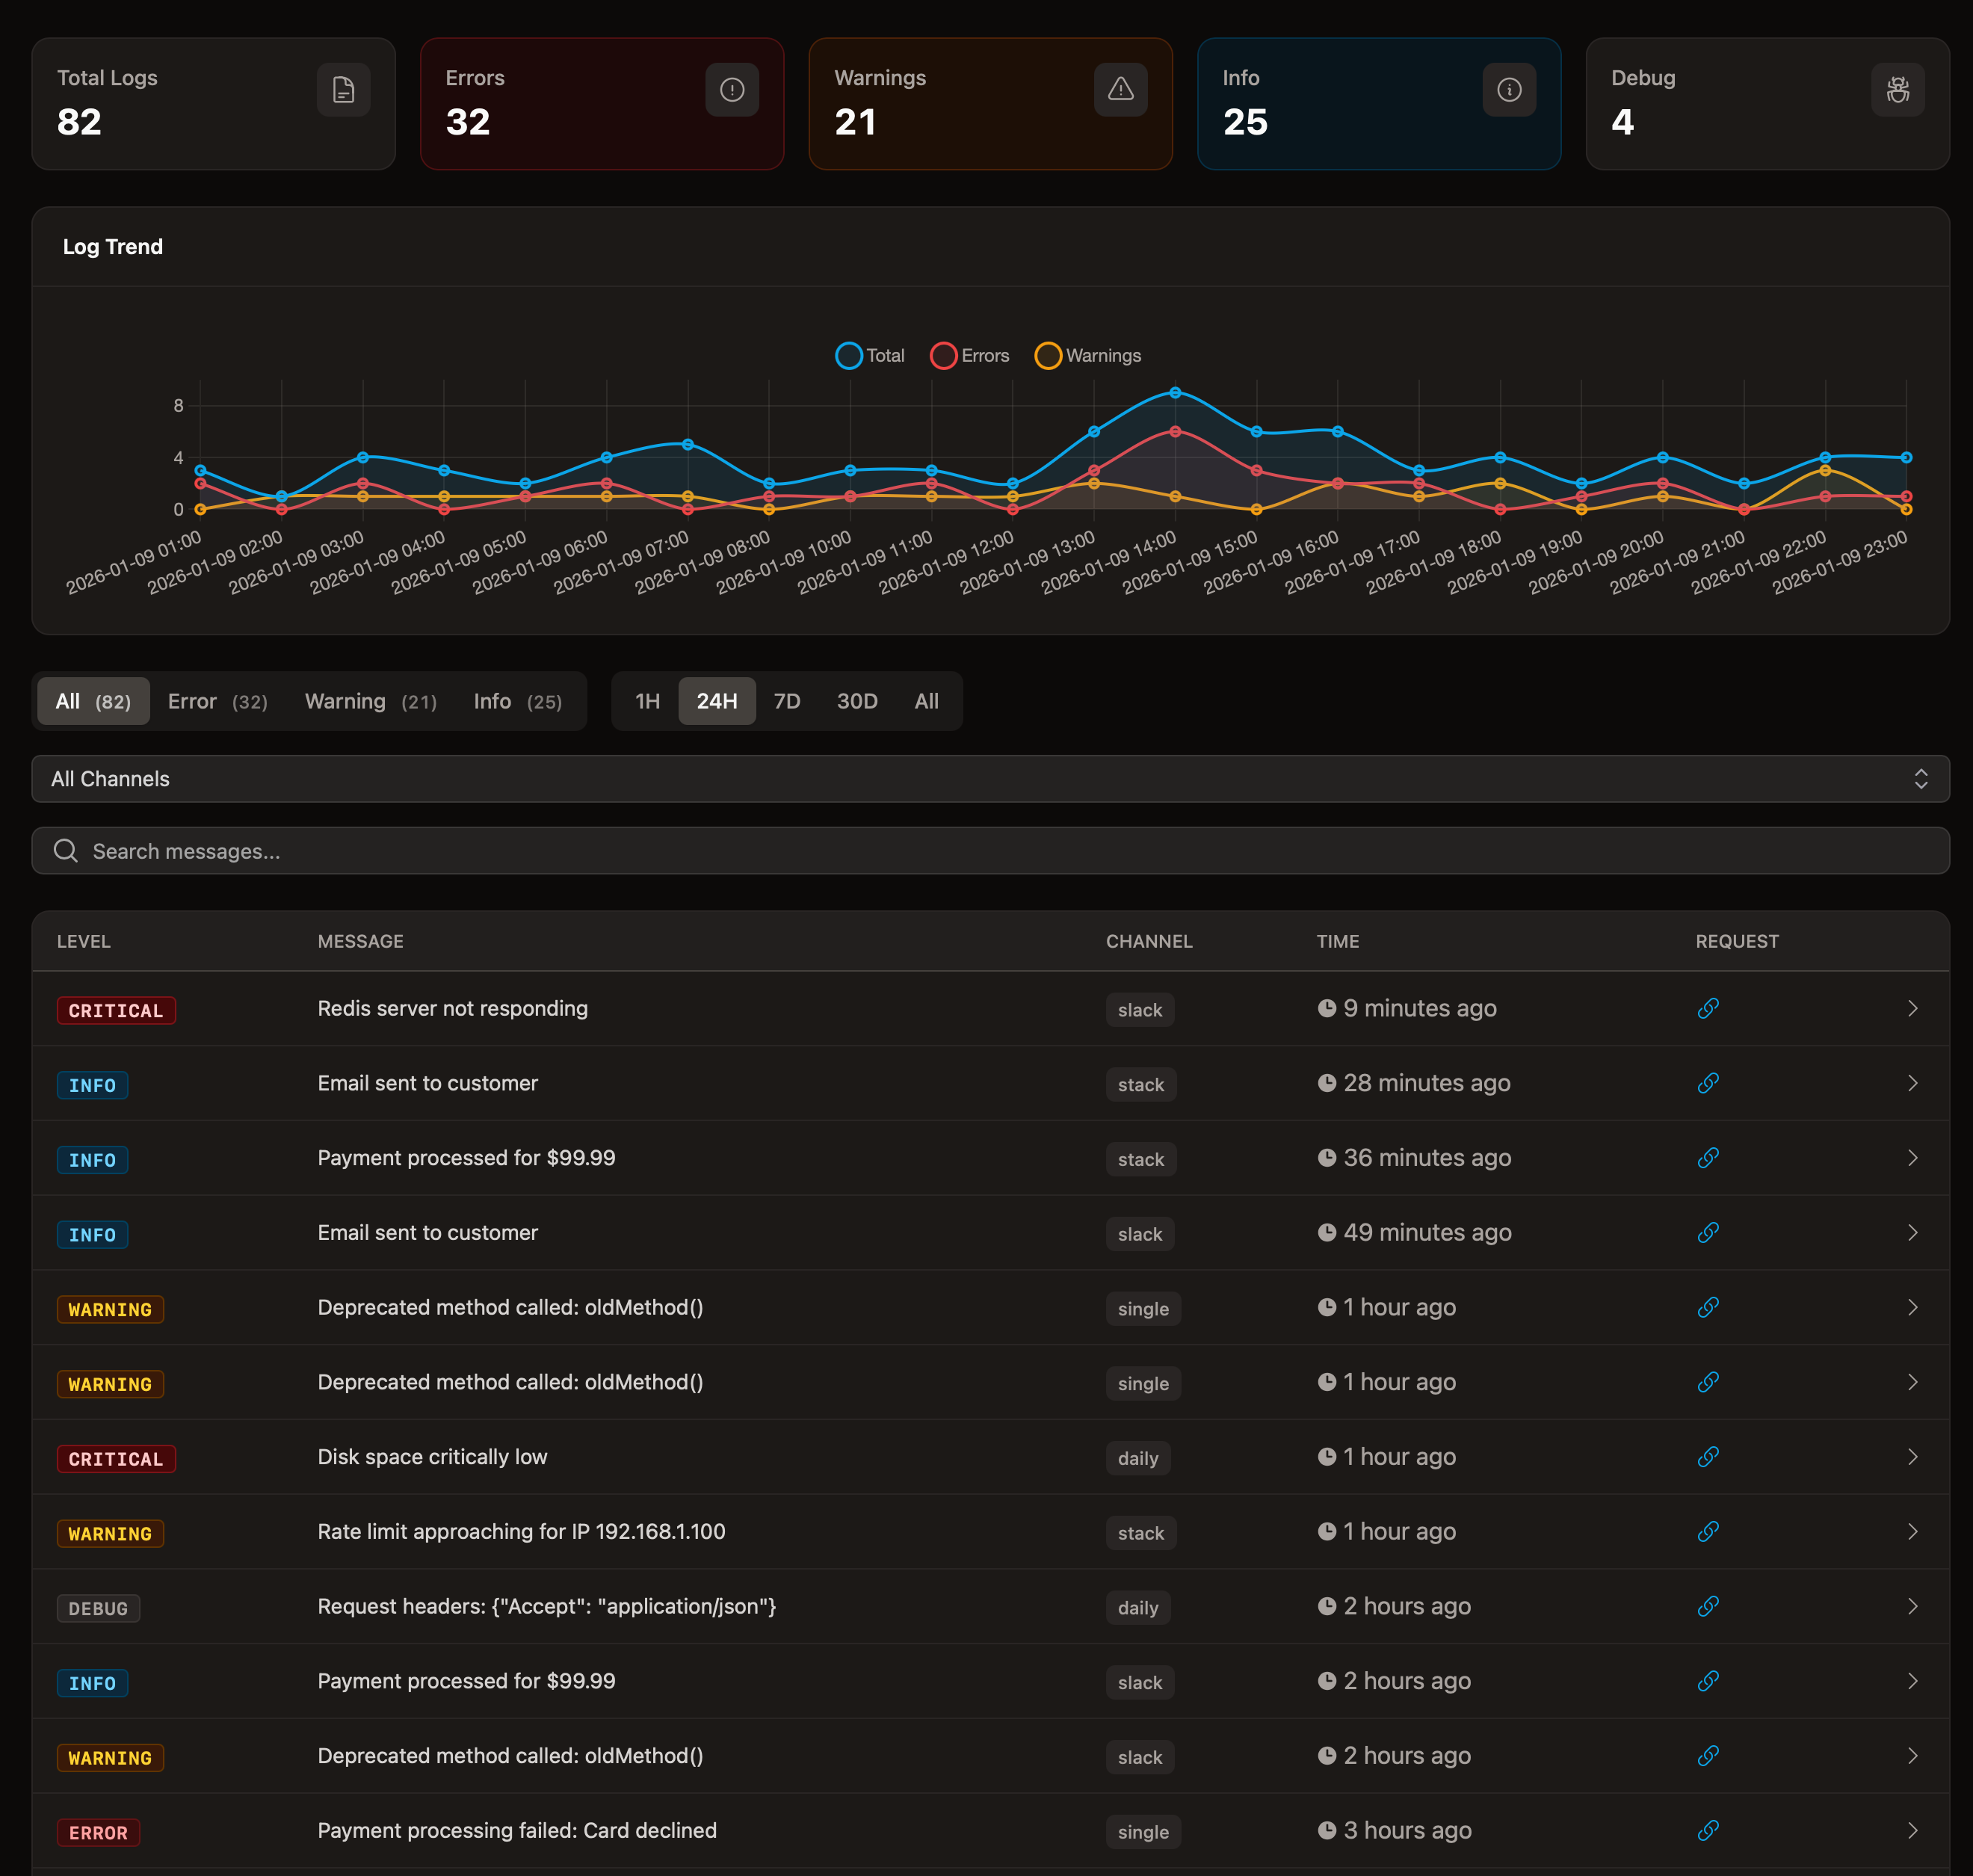
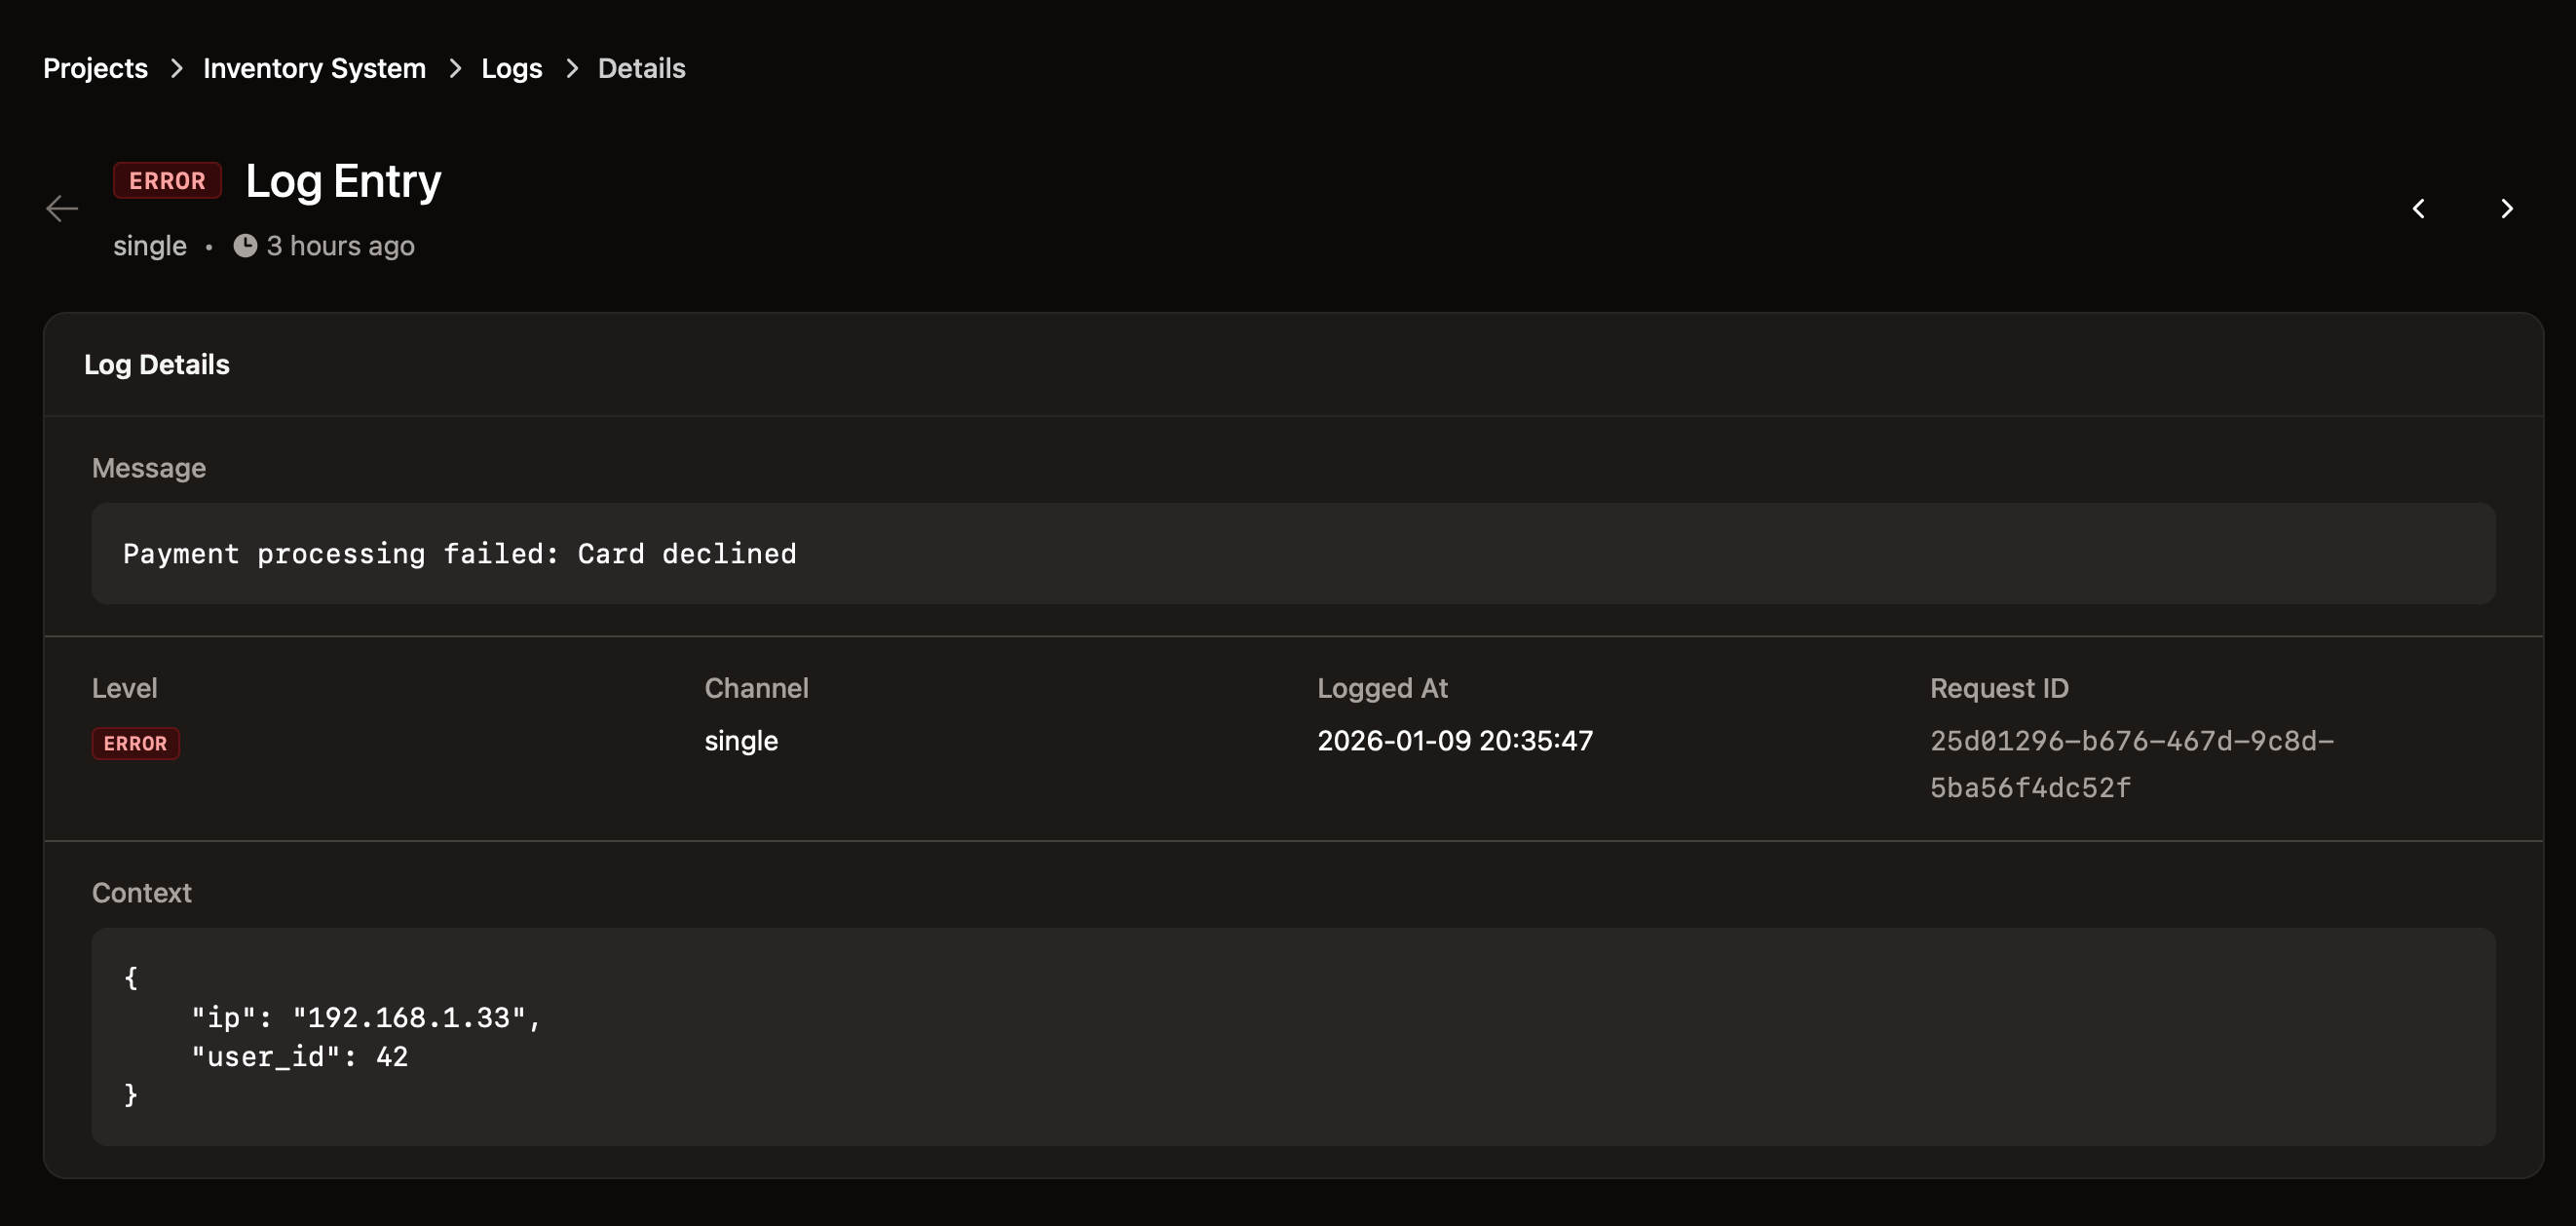
Log entry details with context
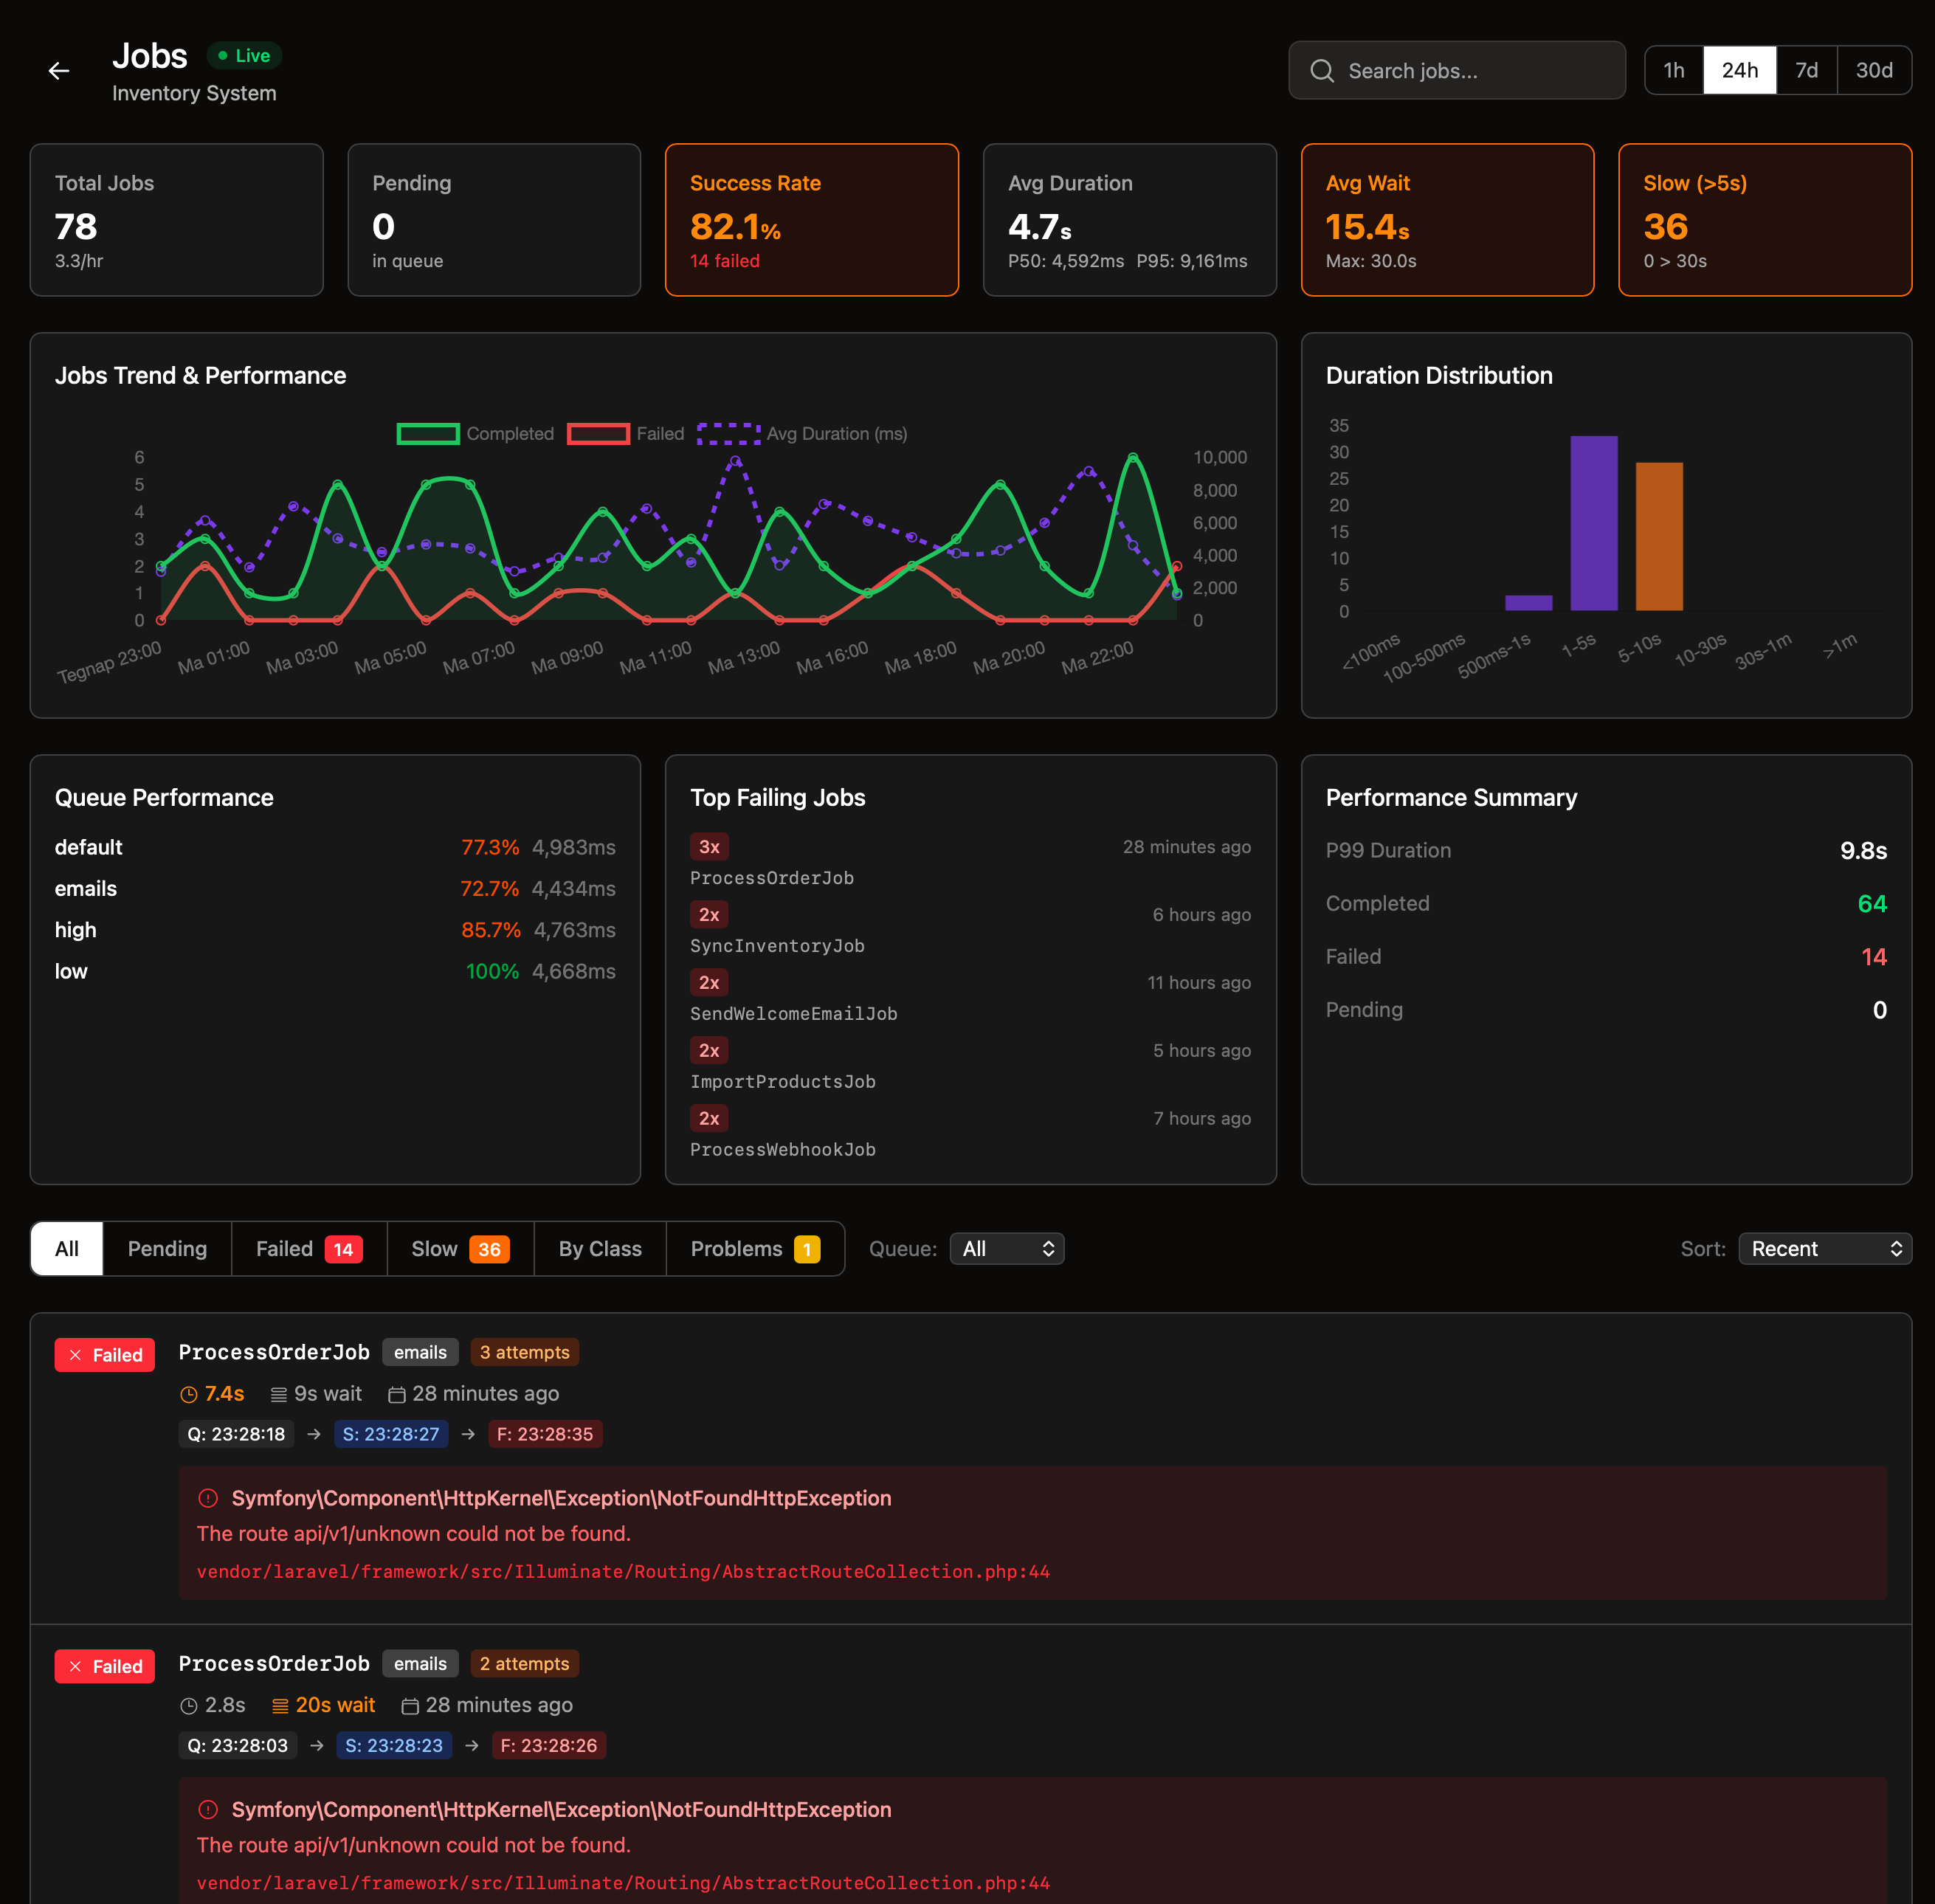
Job Monitoring
Monitor your background jobs in real-time. See when they were queued, when they started, and how long they took. For failed jobs, get the full error message and stack trace.
- Complete job lifecycle tracking
- Detailed failure information
- Wait time and execution duration
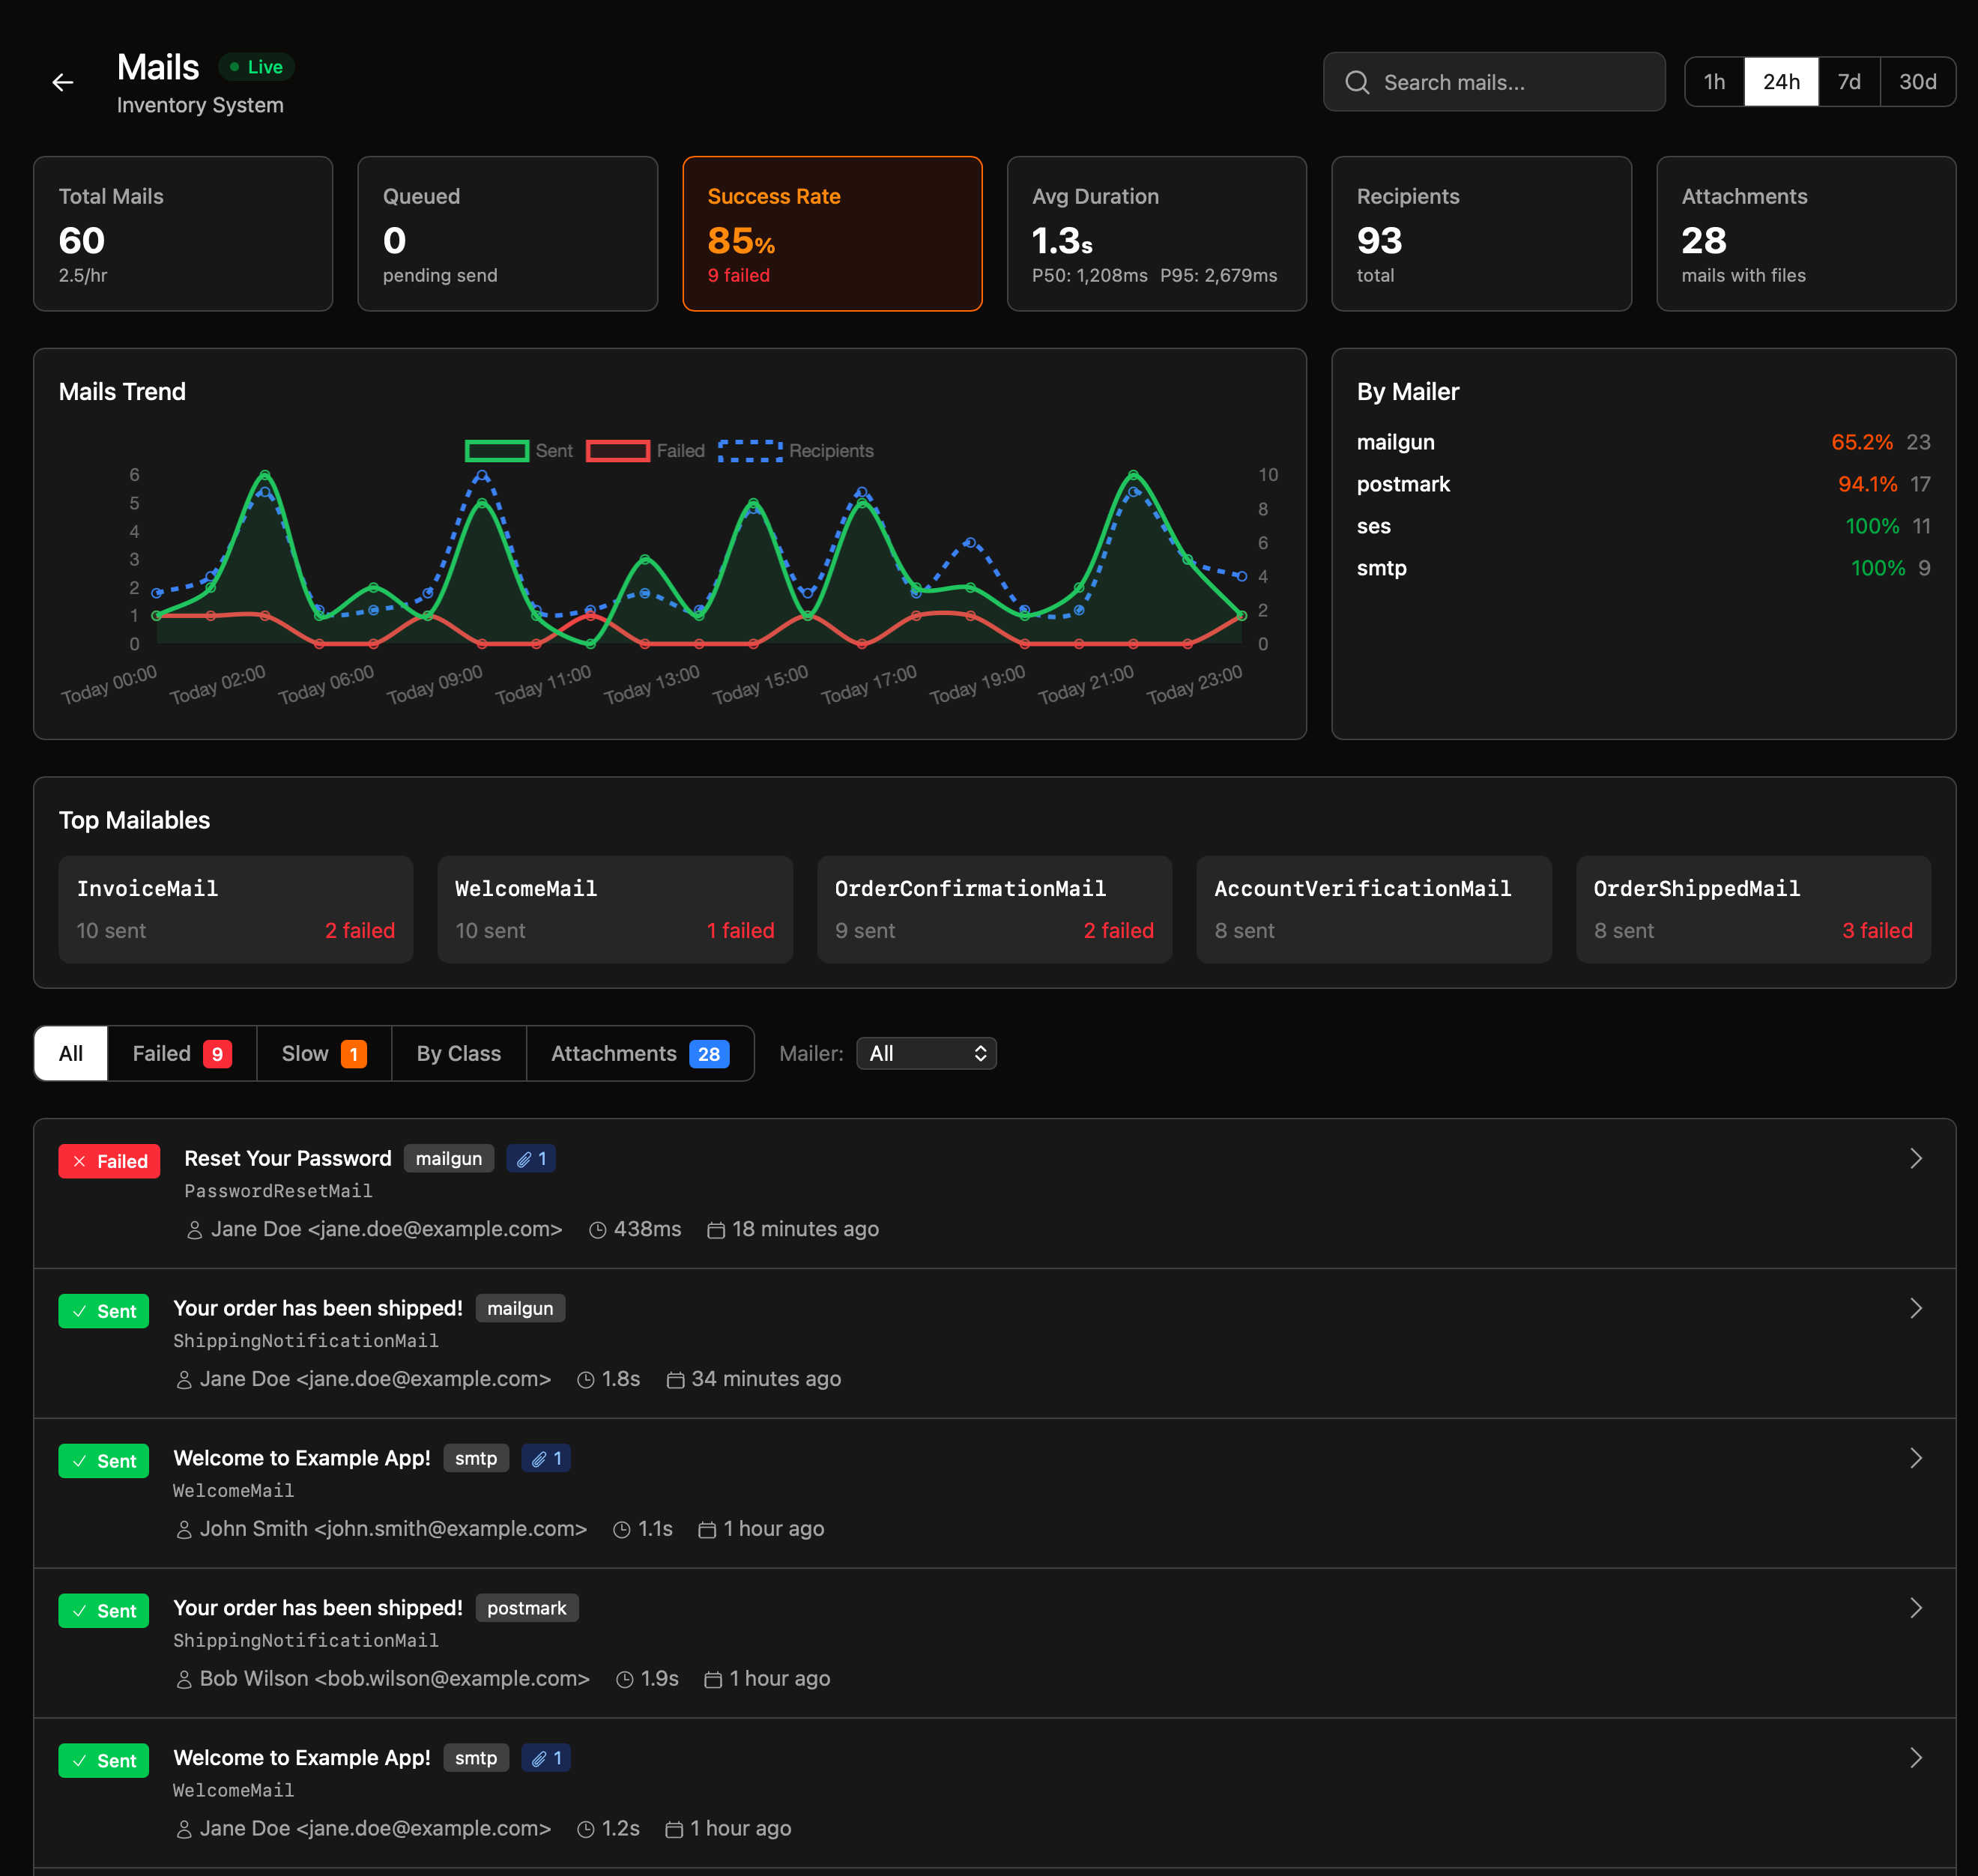
Email Monitoring
Track every outgoing email - see recipients, subjects, attachments, and delivery status. Get instant alerts when an email fails to send and see exactly what went wrong.
- Recipients and attachment details
- Statistics by mailer type
- Instant failure notifications
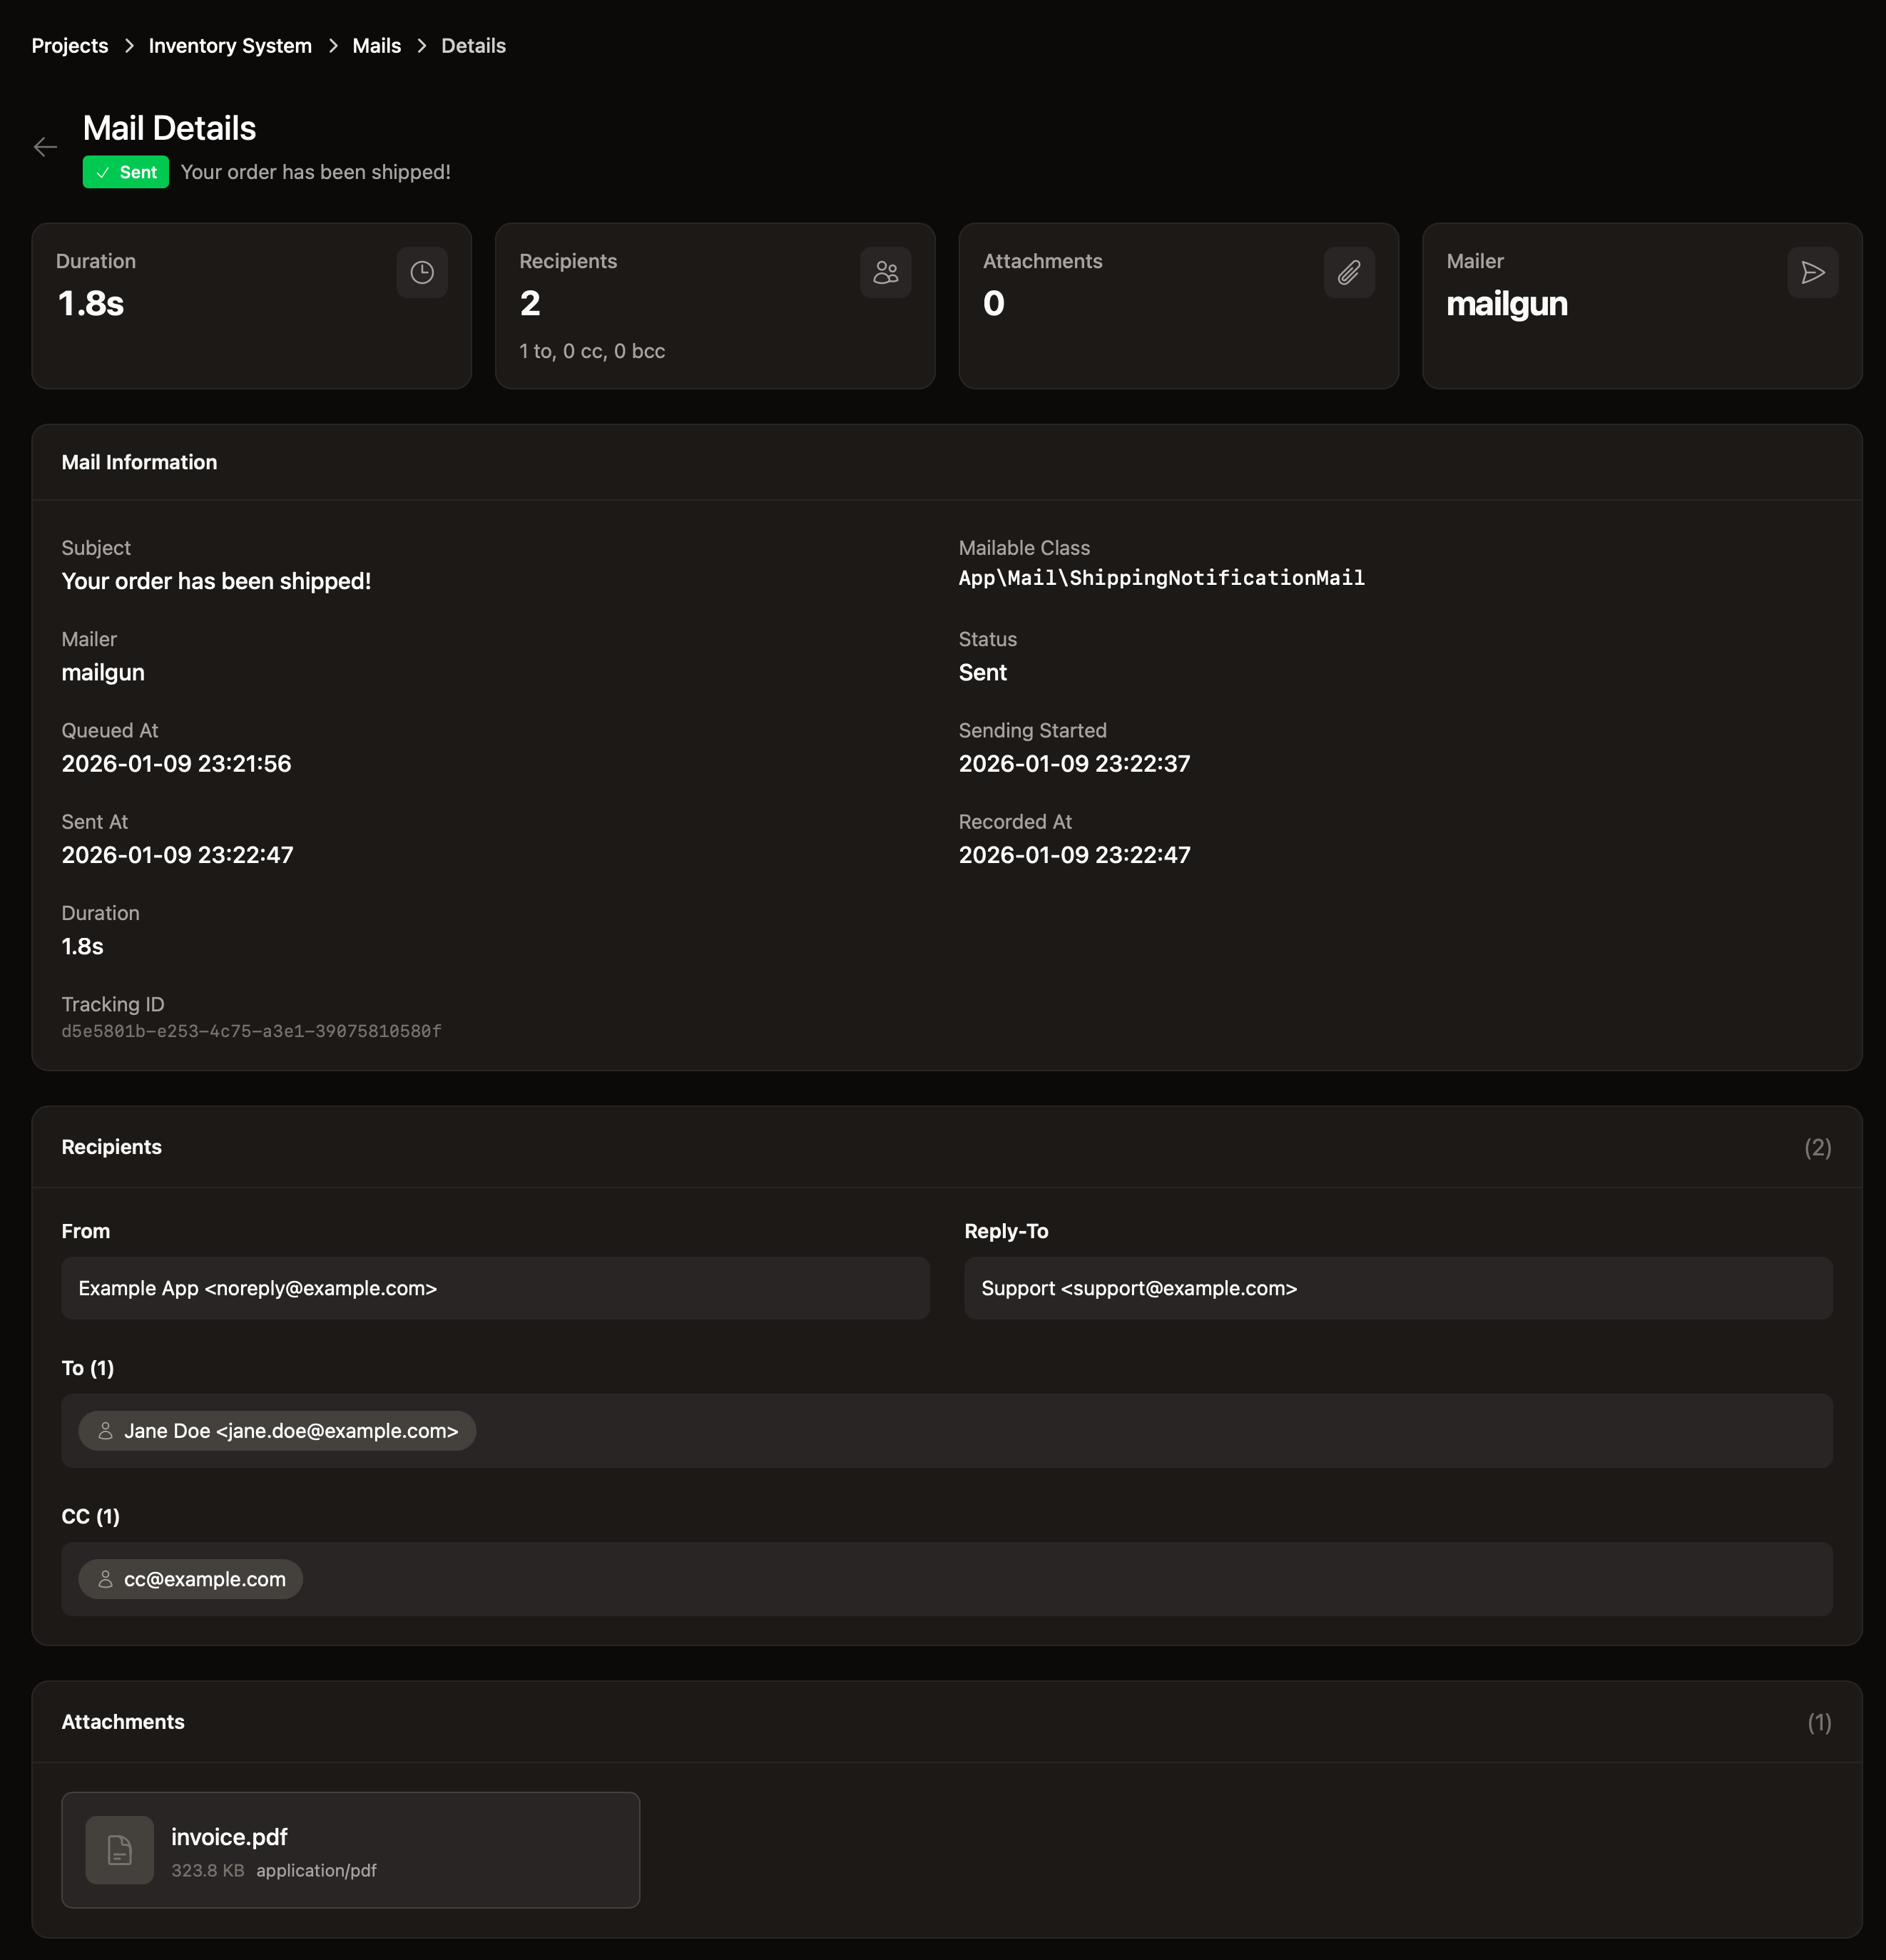
Email details with recipients and attachments
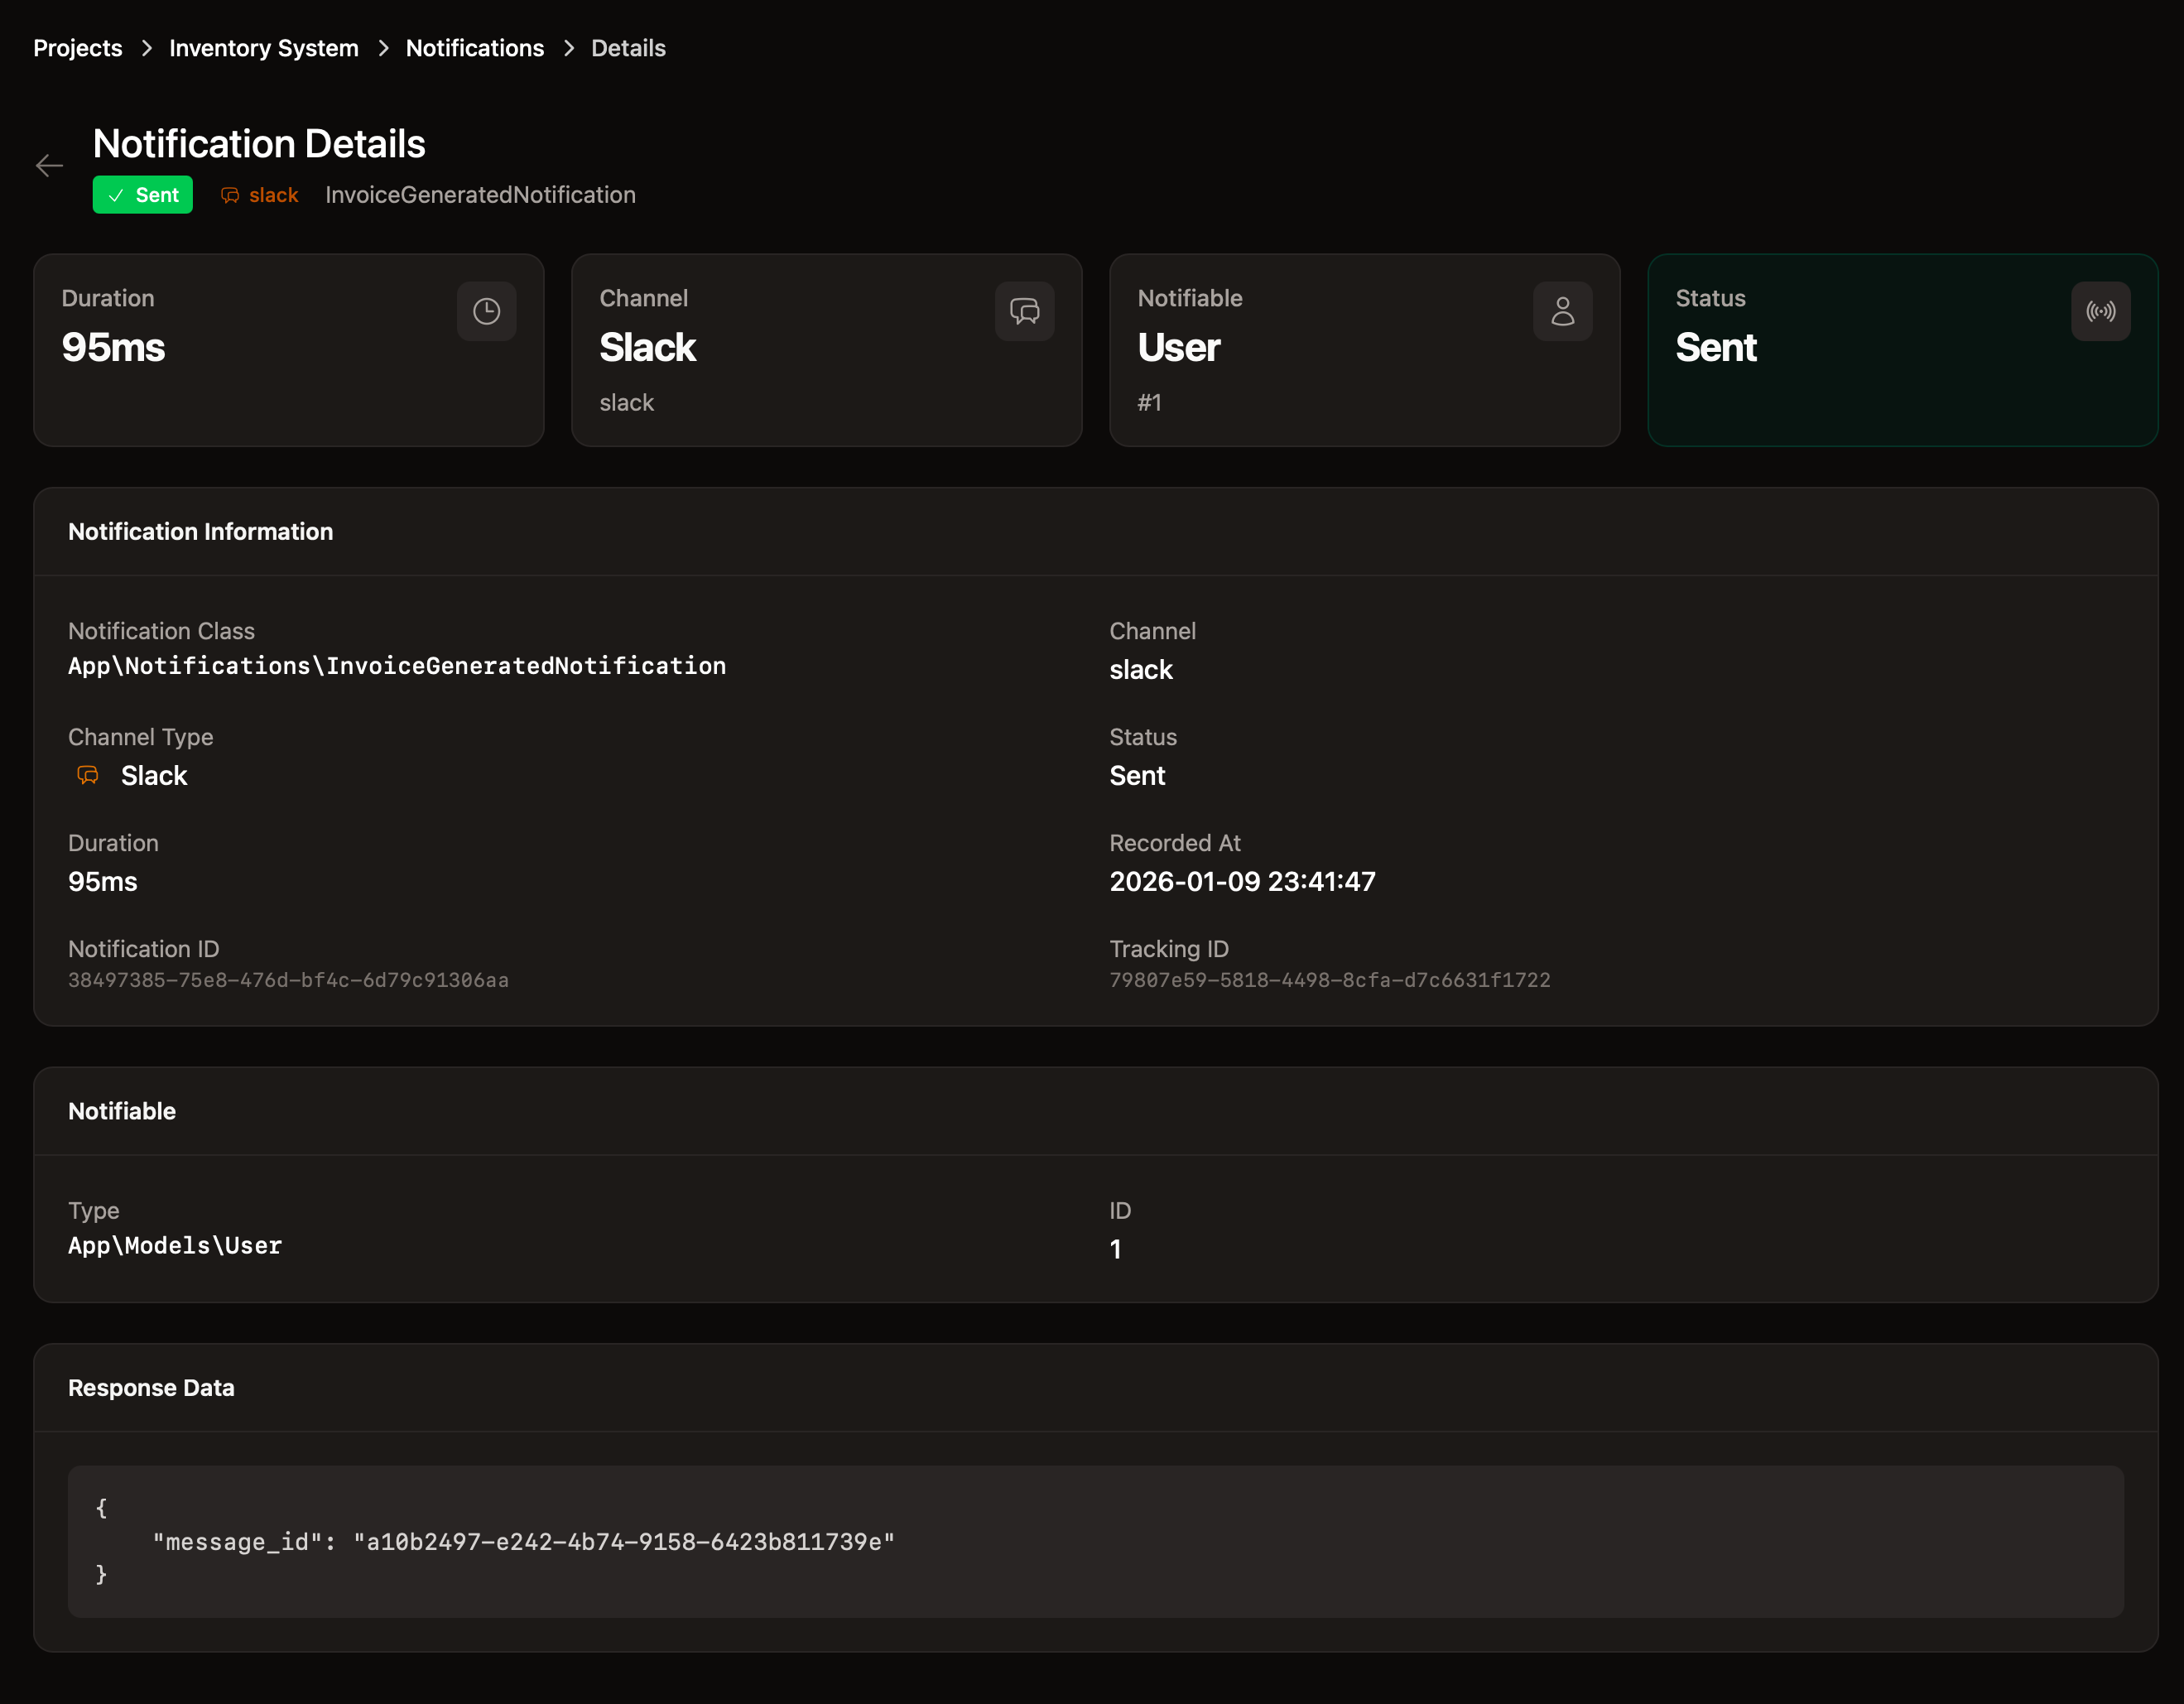
Notification details with channel information
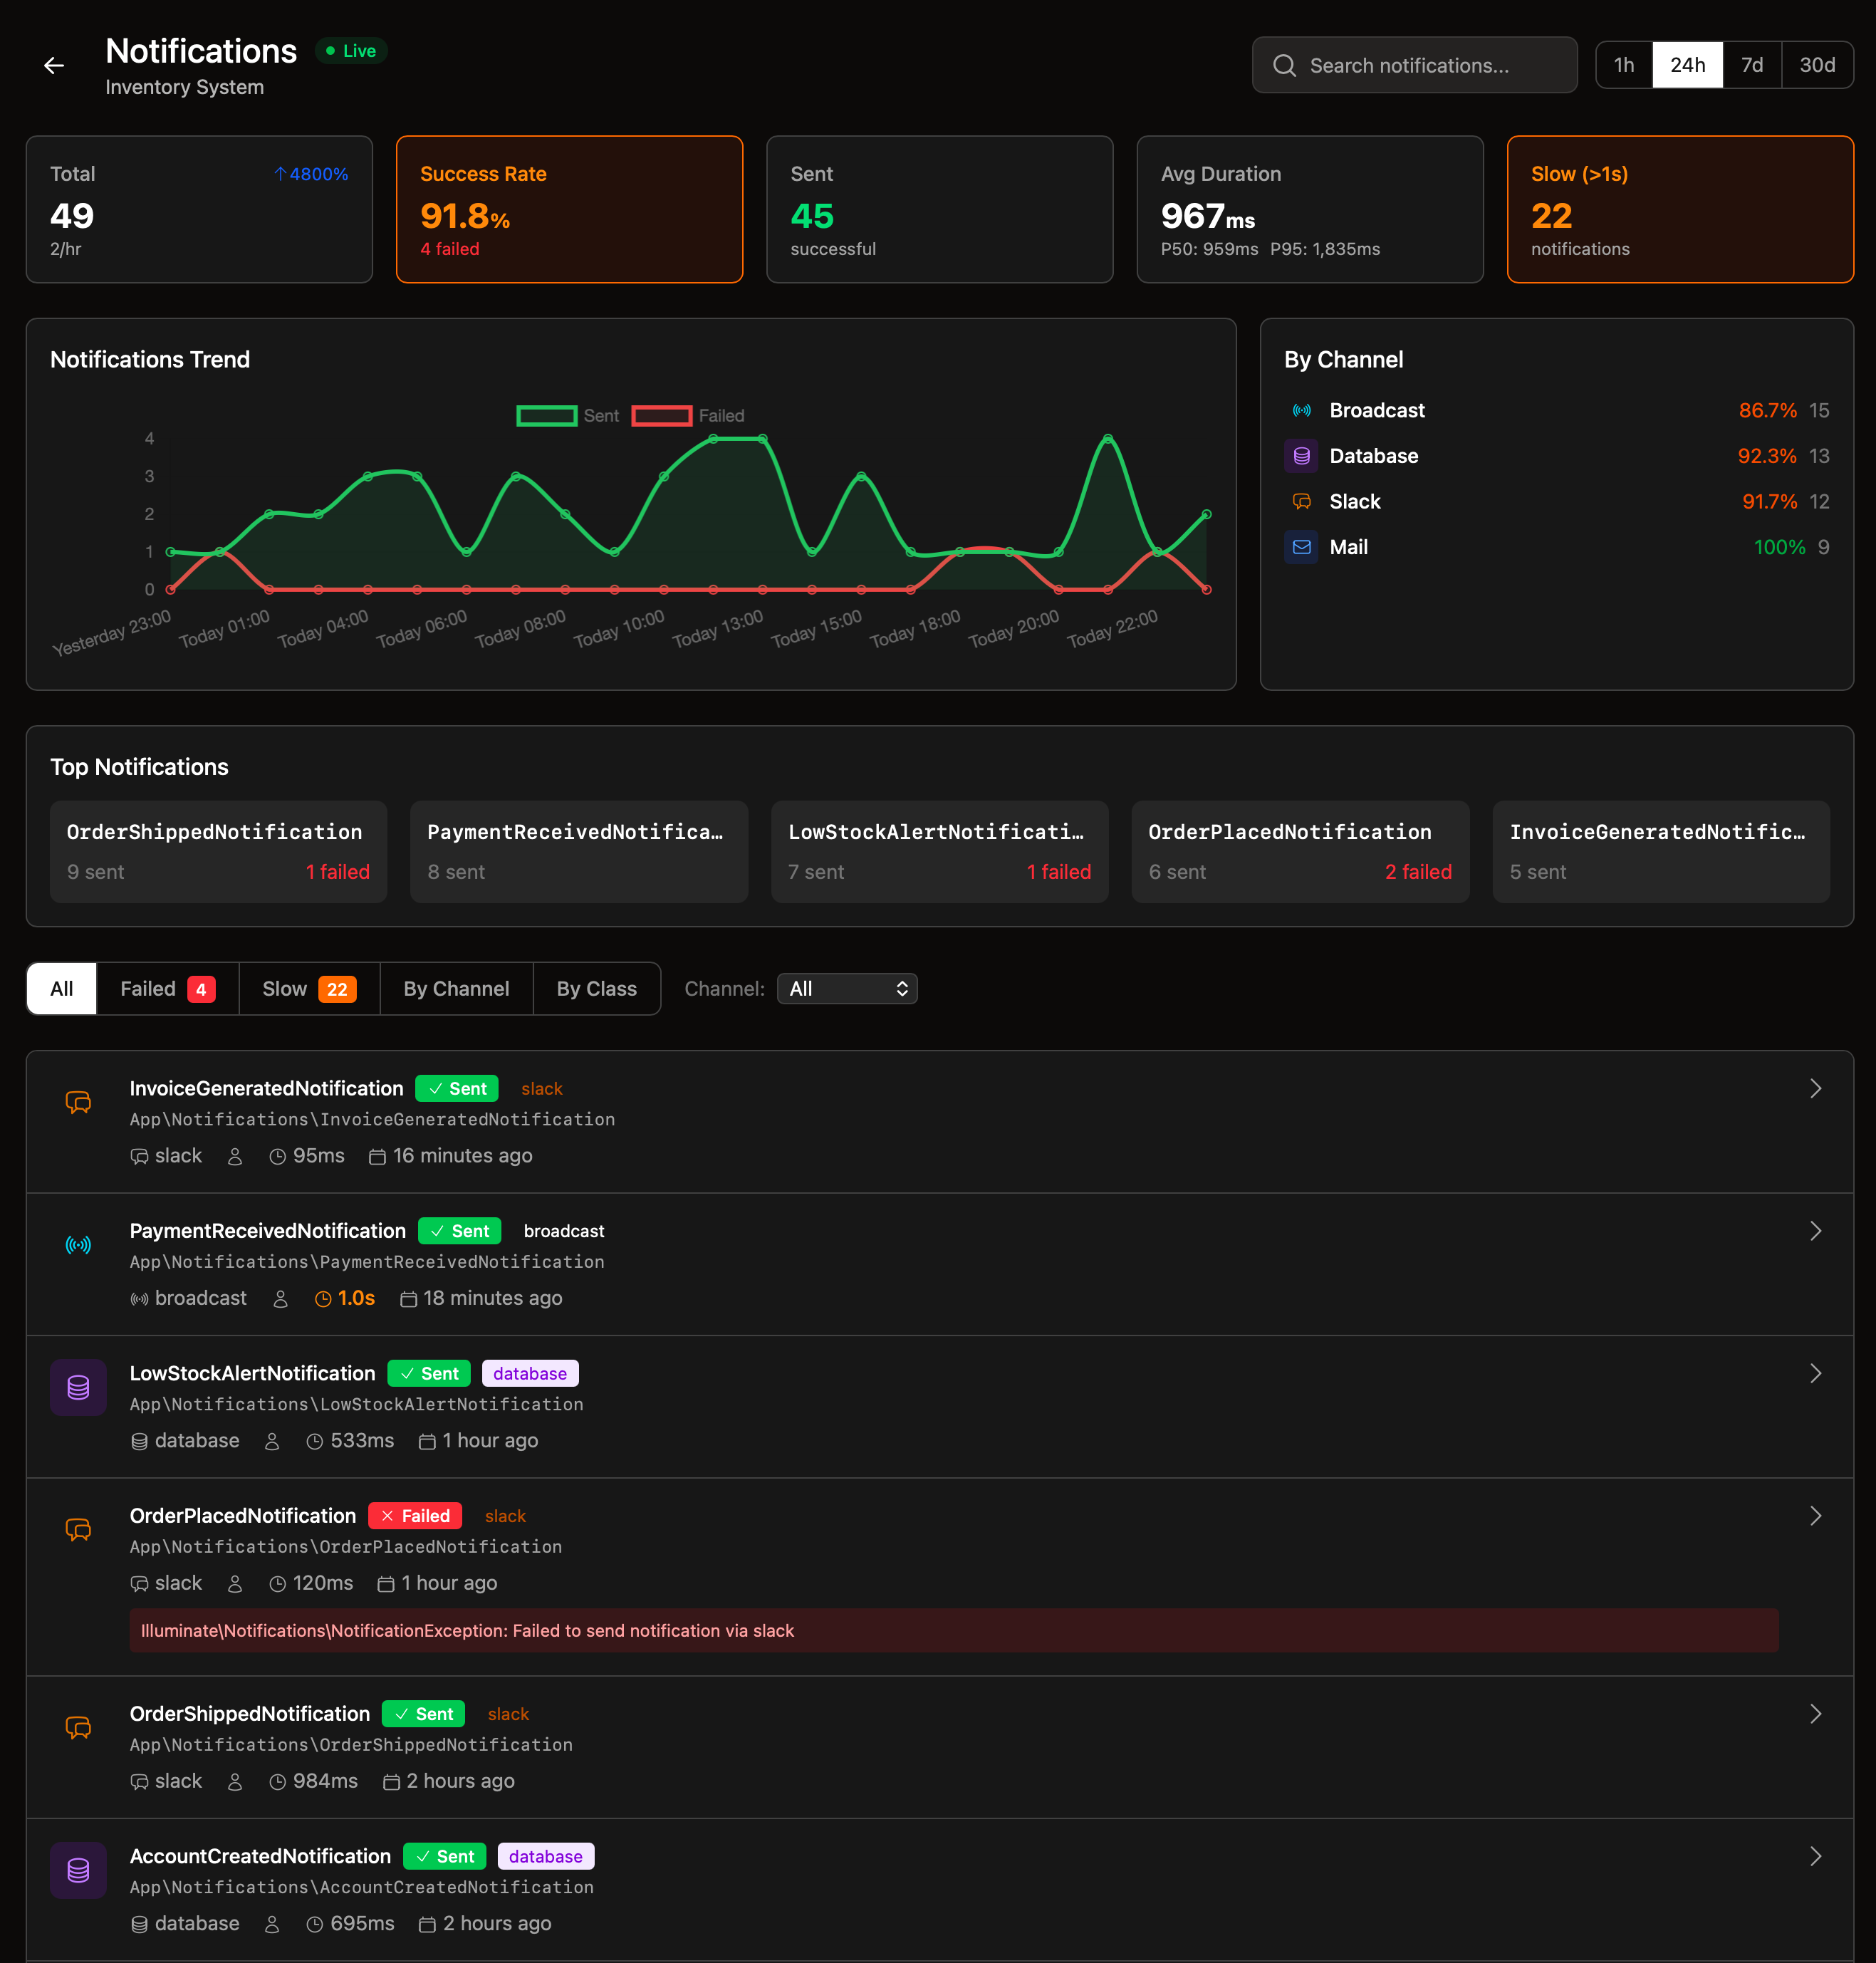
Notification Tracking
Track all Laravel notifications across every channel - email, database, Slack, SMS, or any custom channel. See who received notifications, which channel was used, and whether delivery was successful.
- All notification channels supported
- Notifiable type and ID tracking
- Delivery time and status
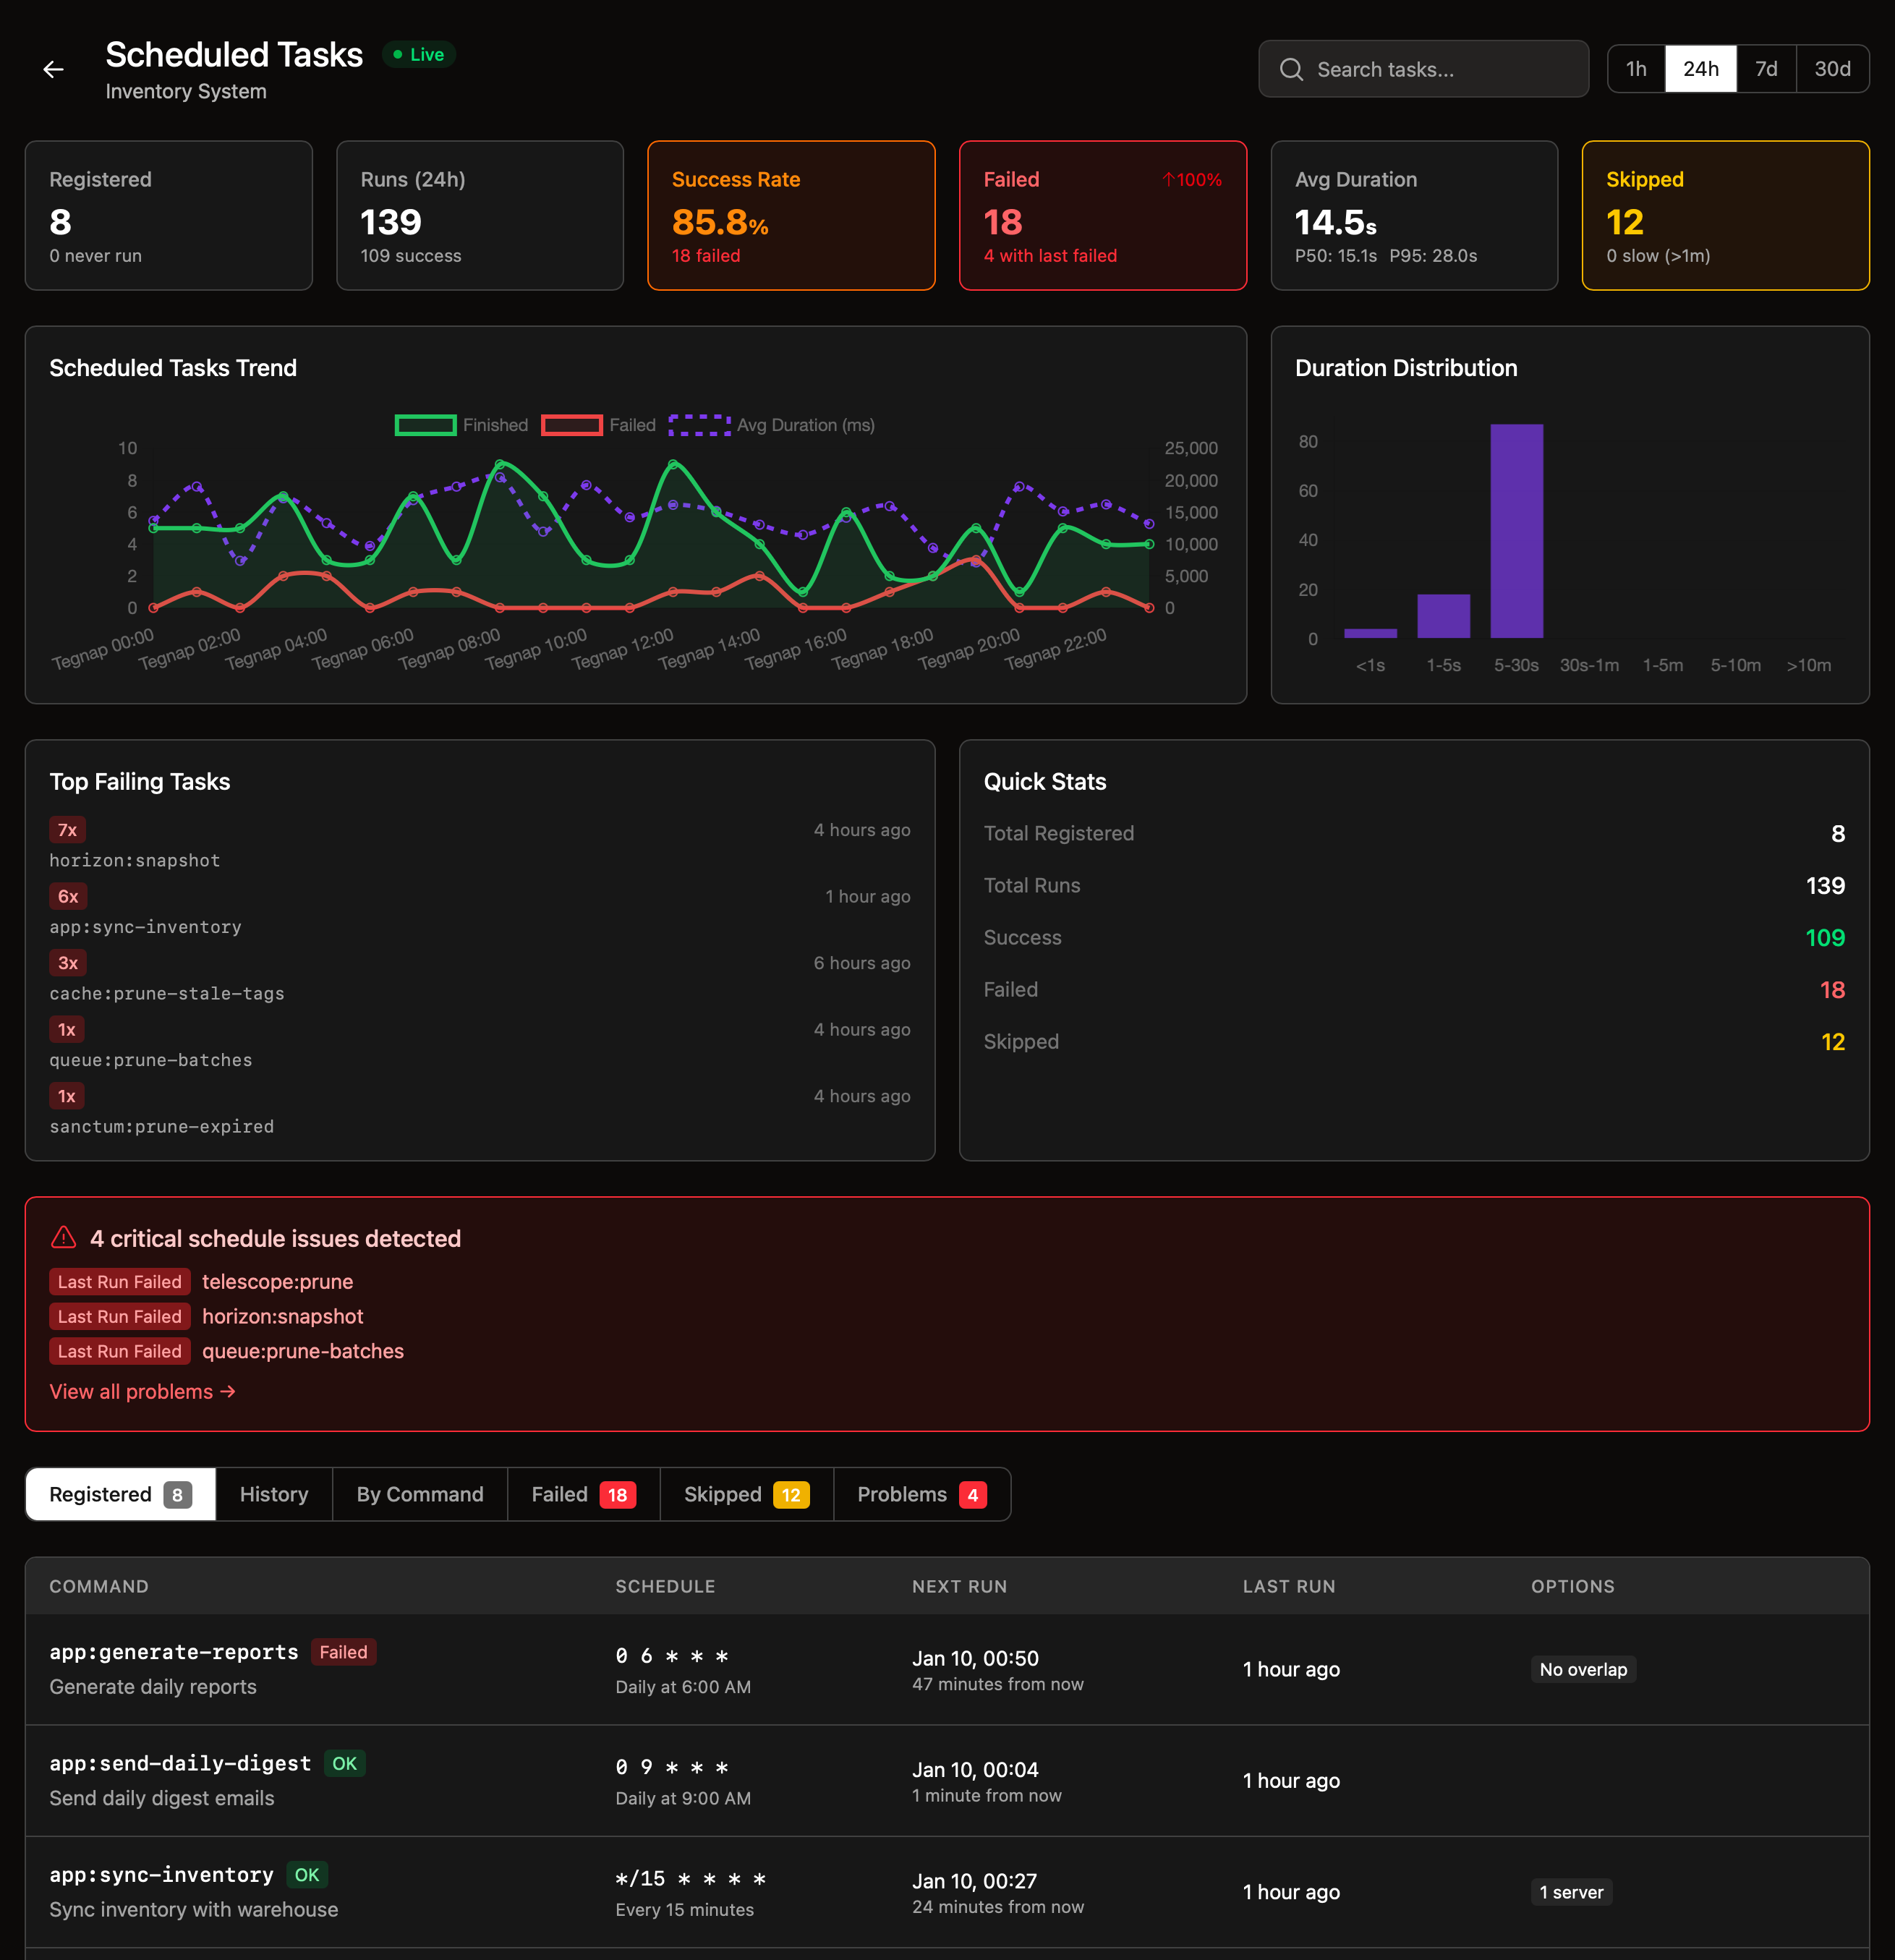
Scheduled Tasks
Monitor all your scheduled tasks. See when they last ran, how long they took, and if they failed, what went wrong. Get alerts when a task doesn't run at the expected time.
- Cron expressions and next run time
- Execution history and output
- Overlap and skip handling
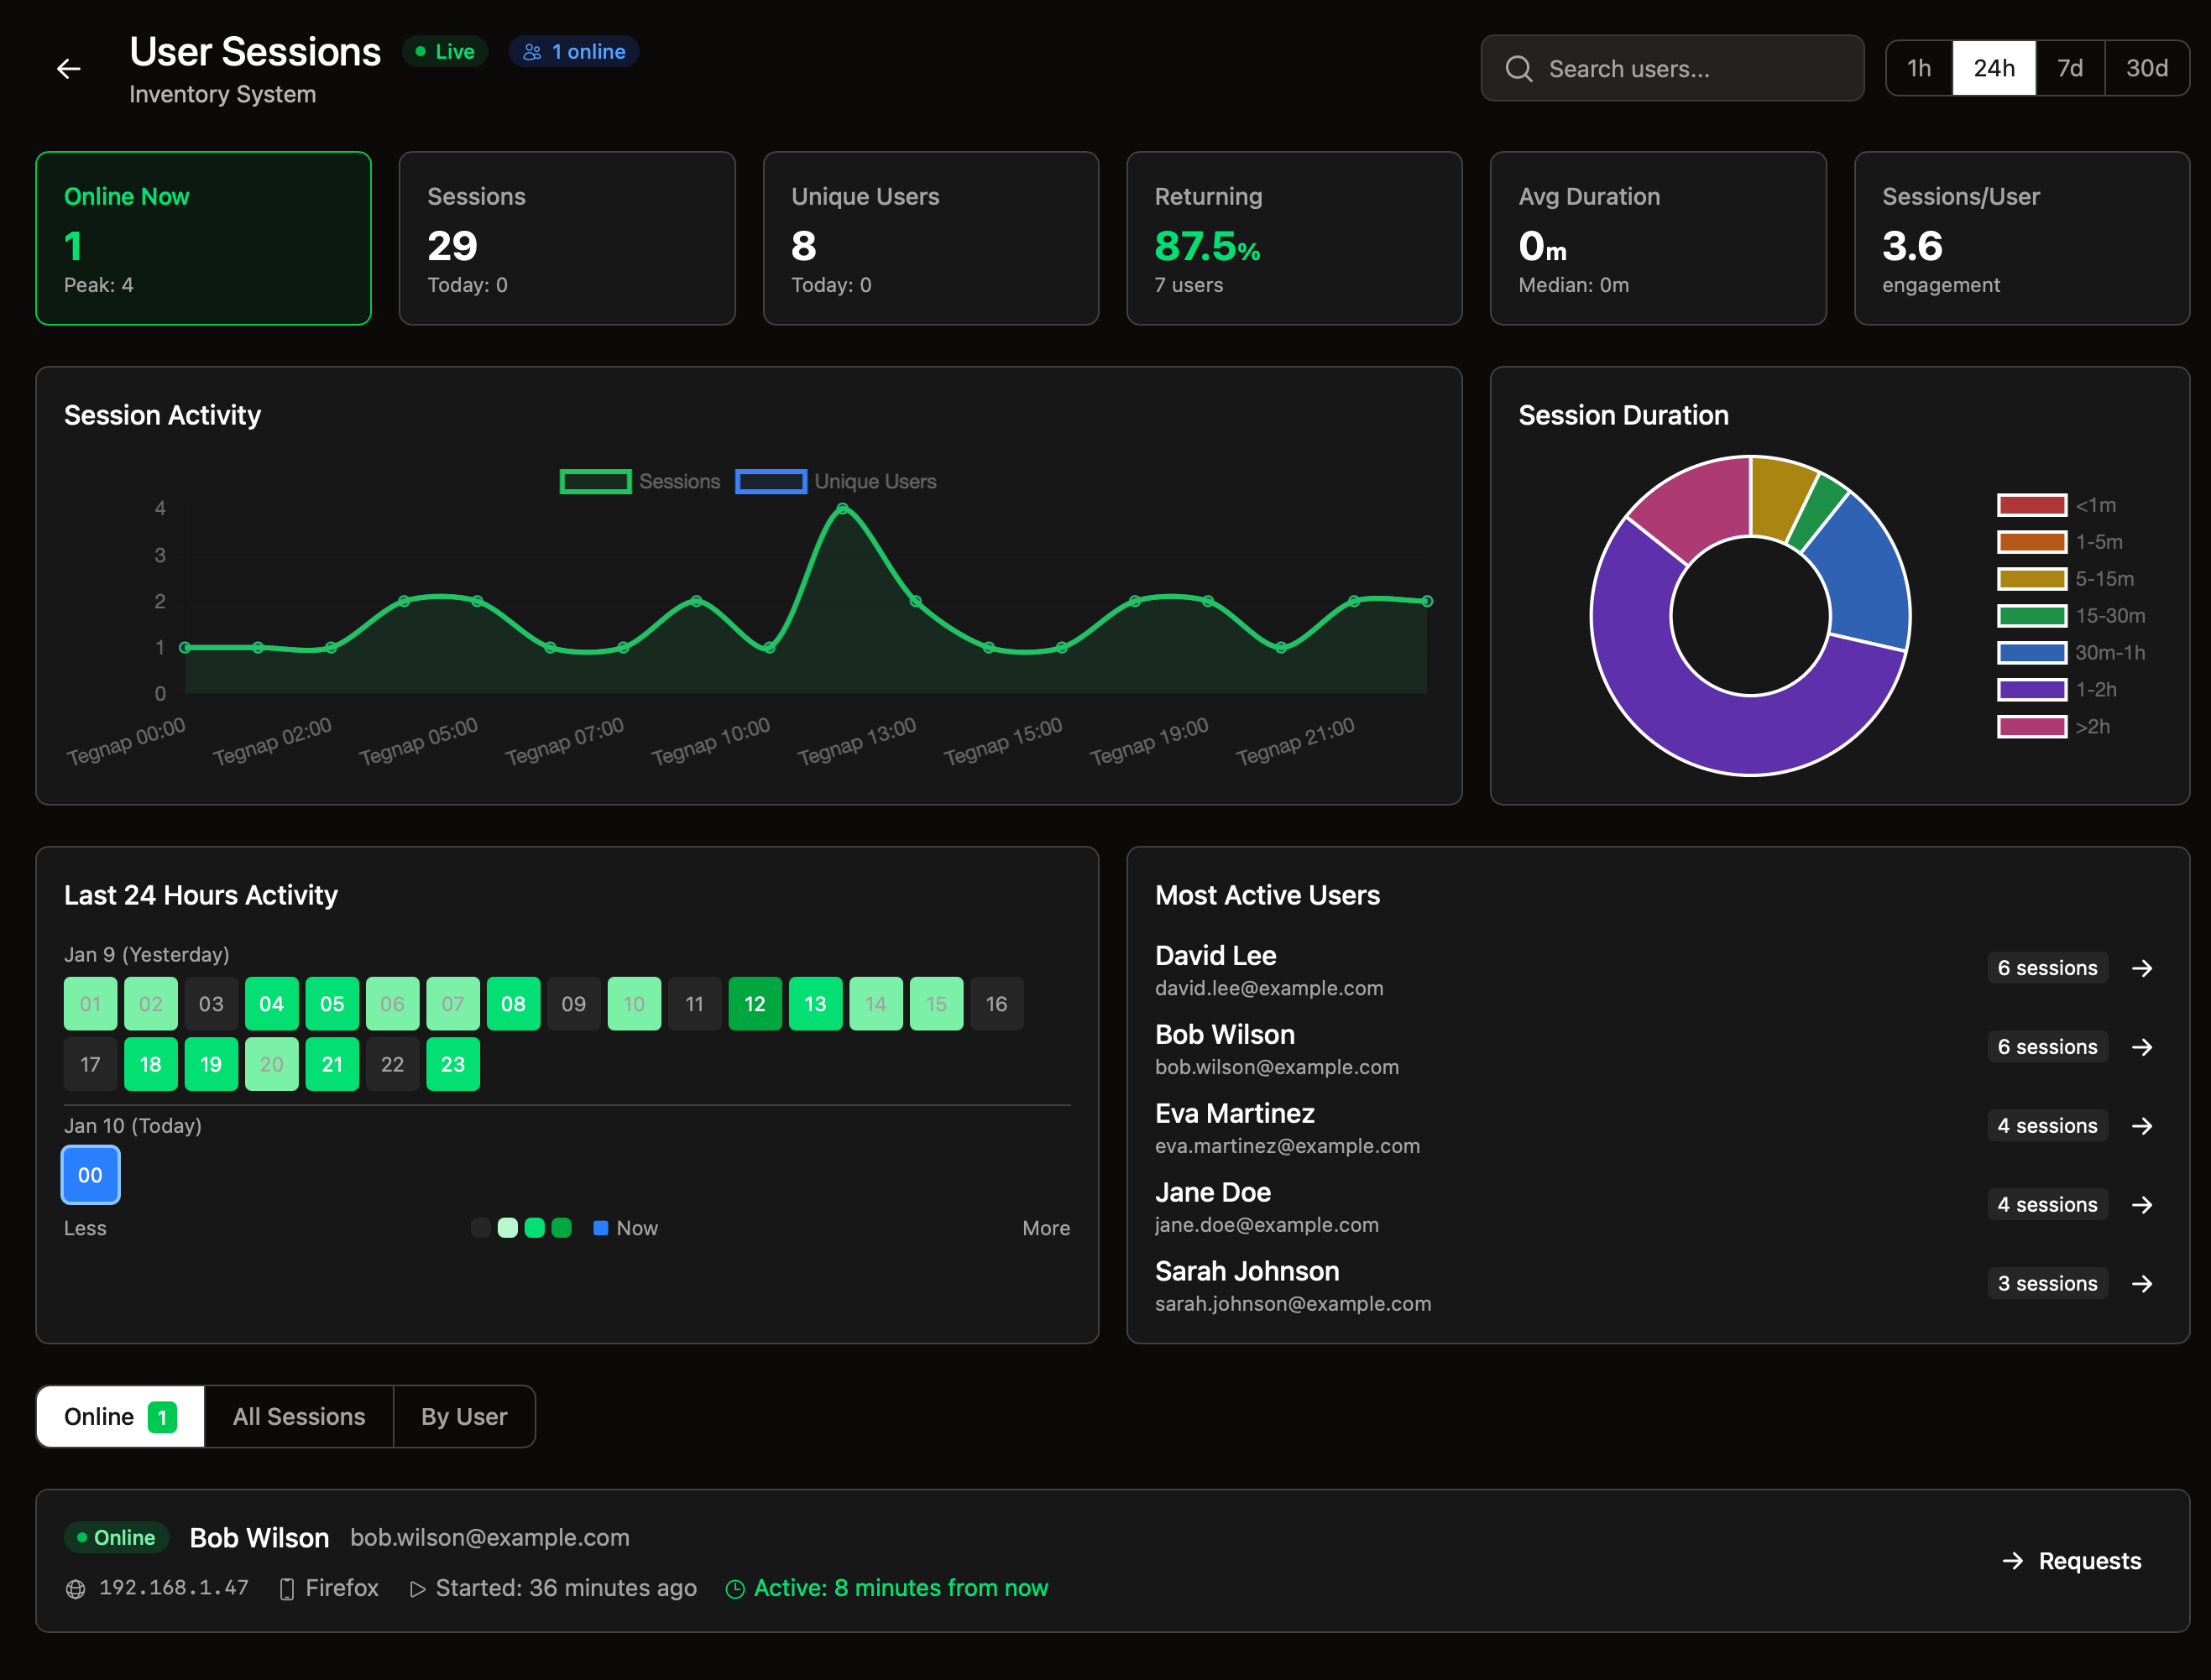
Session Tracking
See who's logged into your application in real-time. Track user activity, login locations, and devices used. Useful for both security monitoring and analytics.
- Real-time online user tracking
- IP address and User Agent info
- Session duration and activity
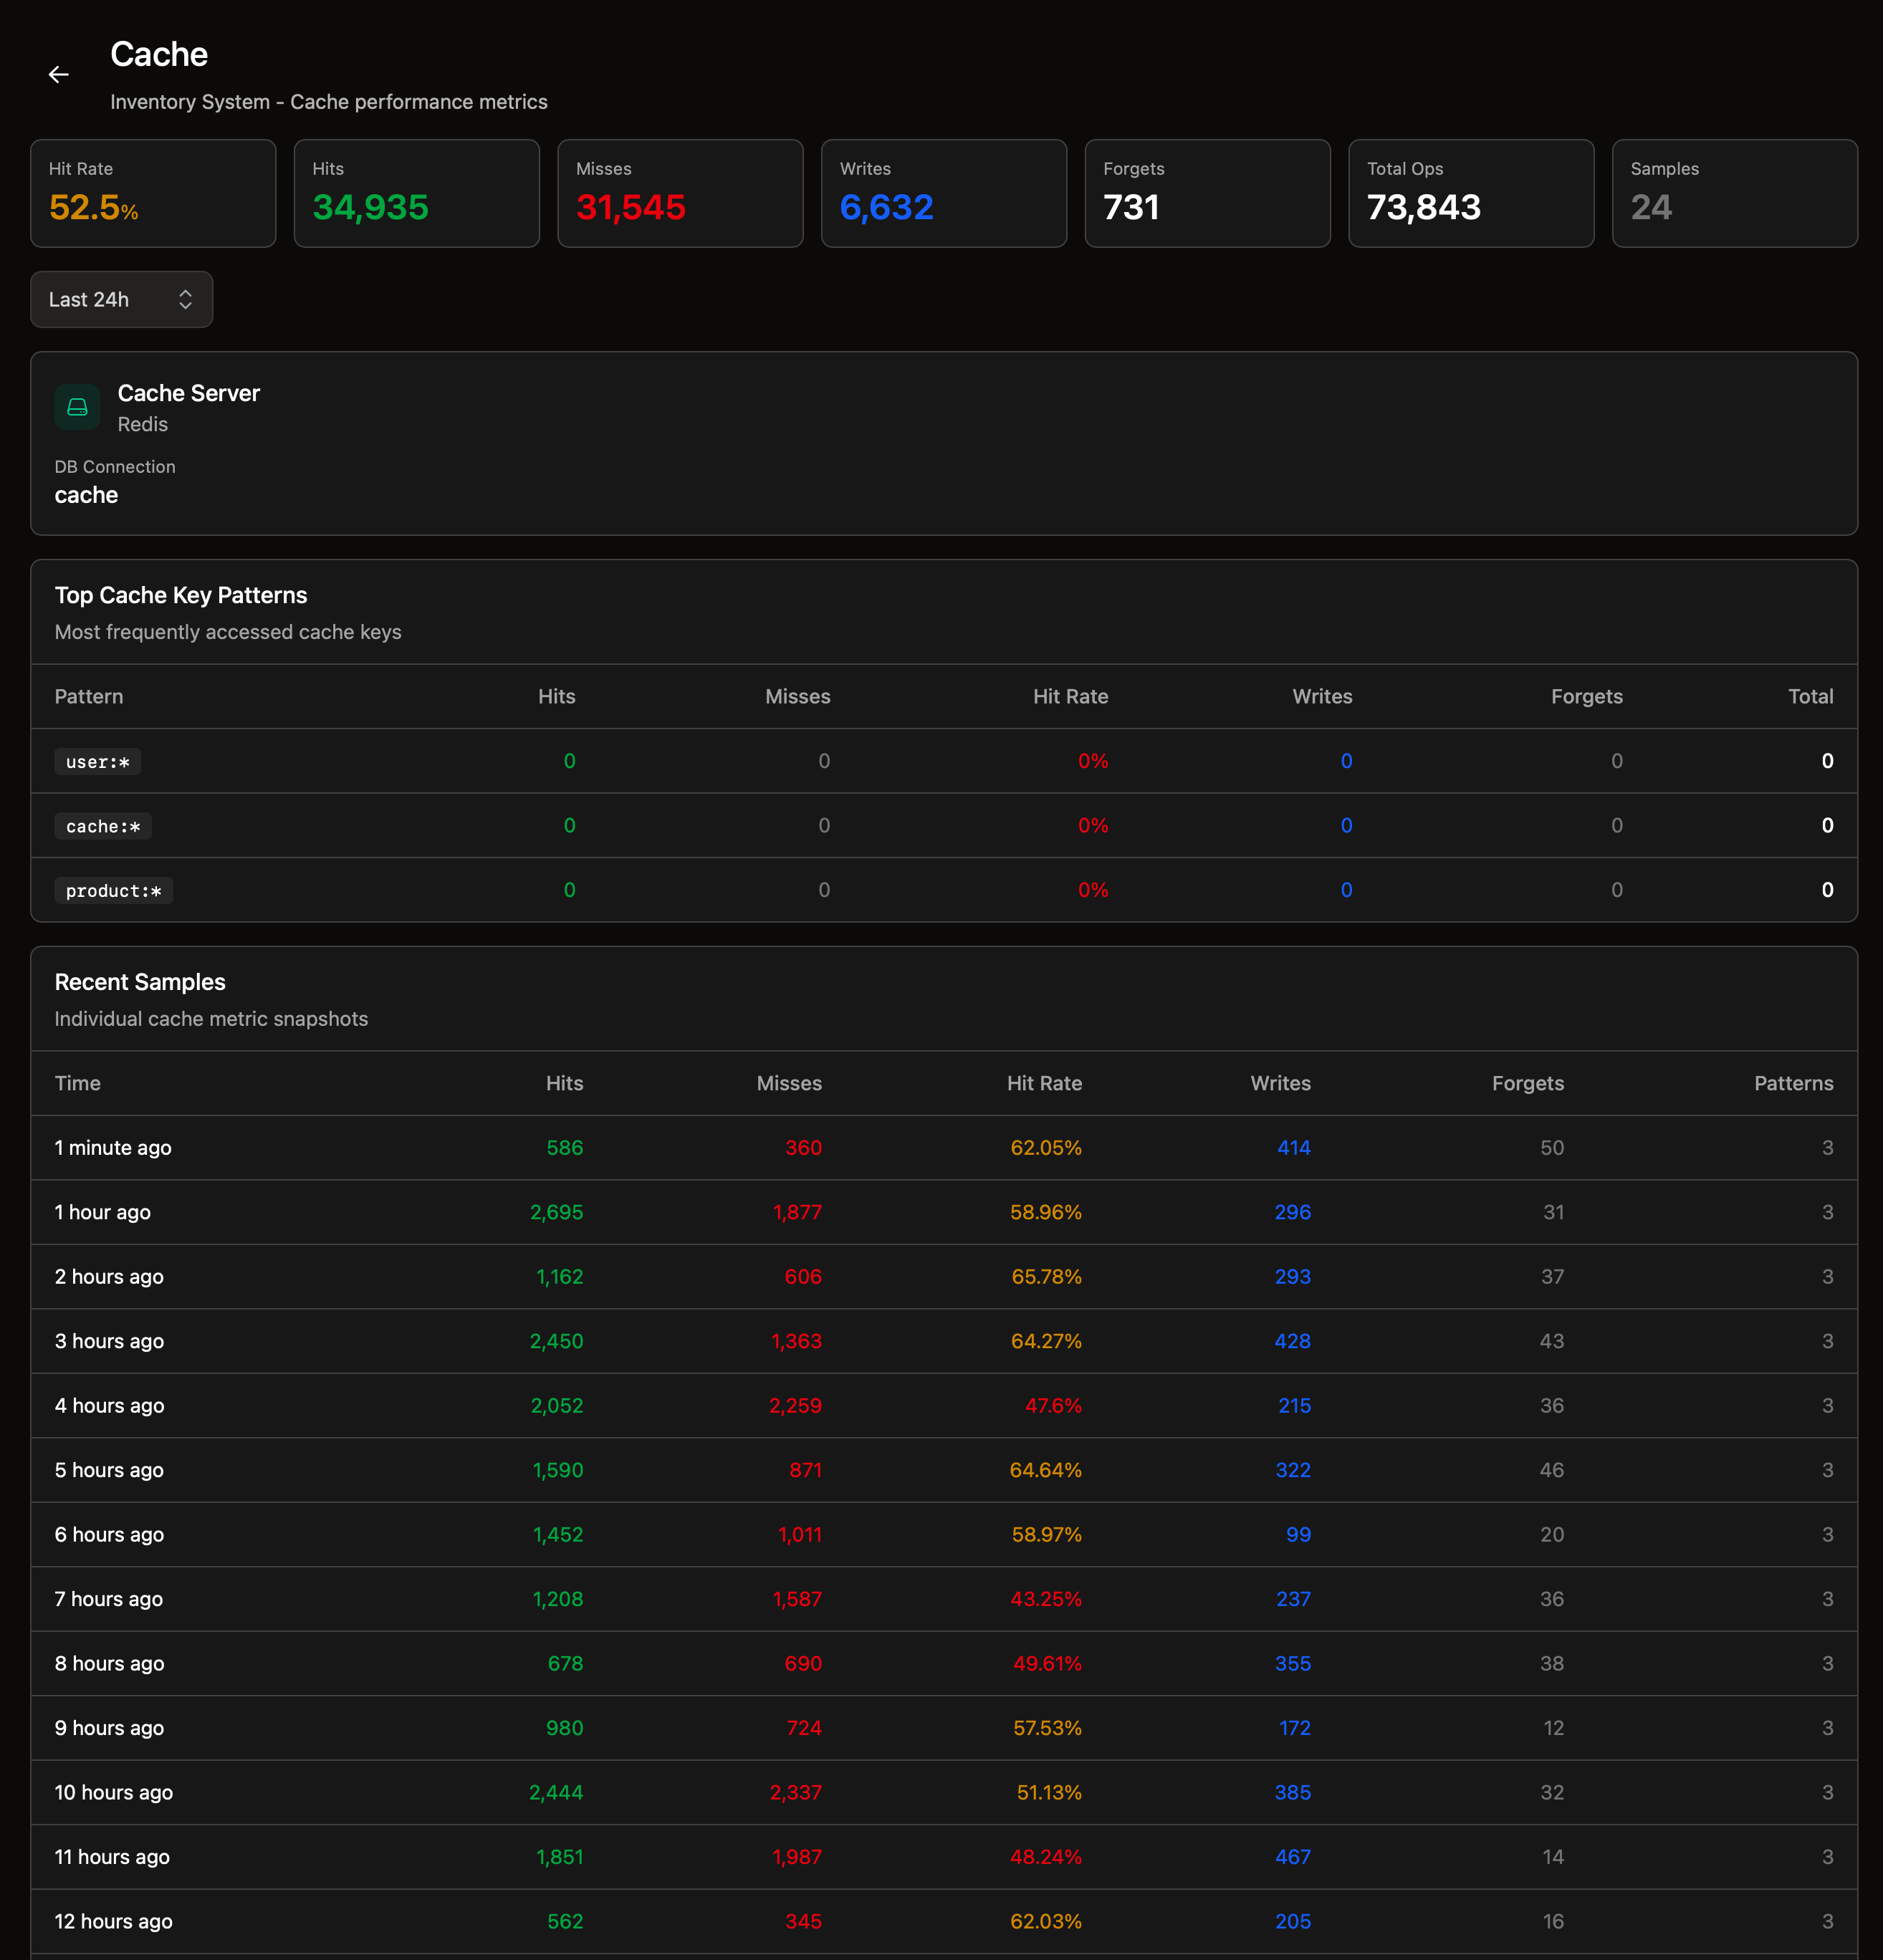
Cache Analytics
Analyze your cache performance. See hit/miss ratios, identify missing keys, and optimize your caching strategy. Supports Redis, Memcached, and file-based caching.
- Hit/miss ratio over time
- Key patterns and frequencies
- Write and delete operation counts
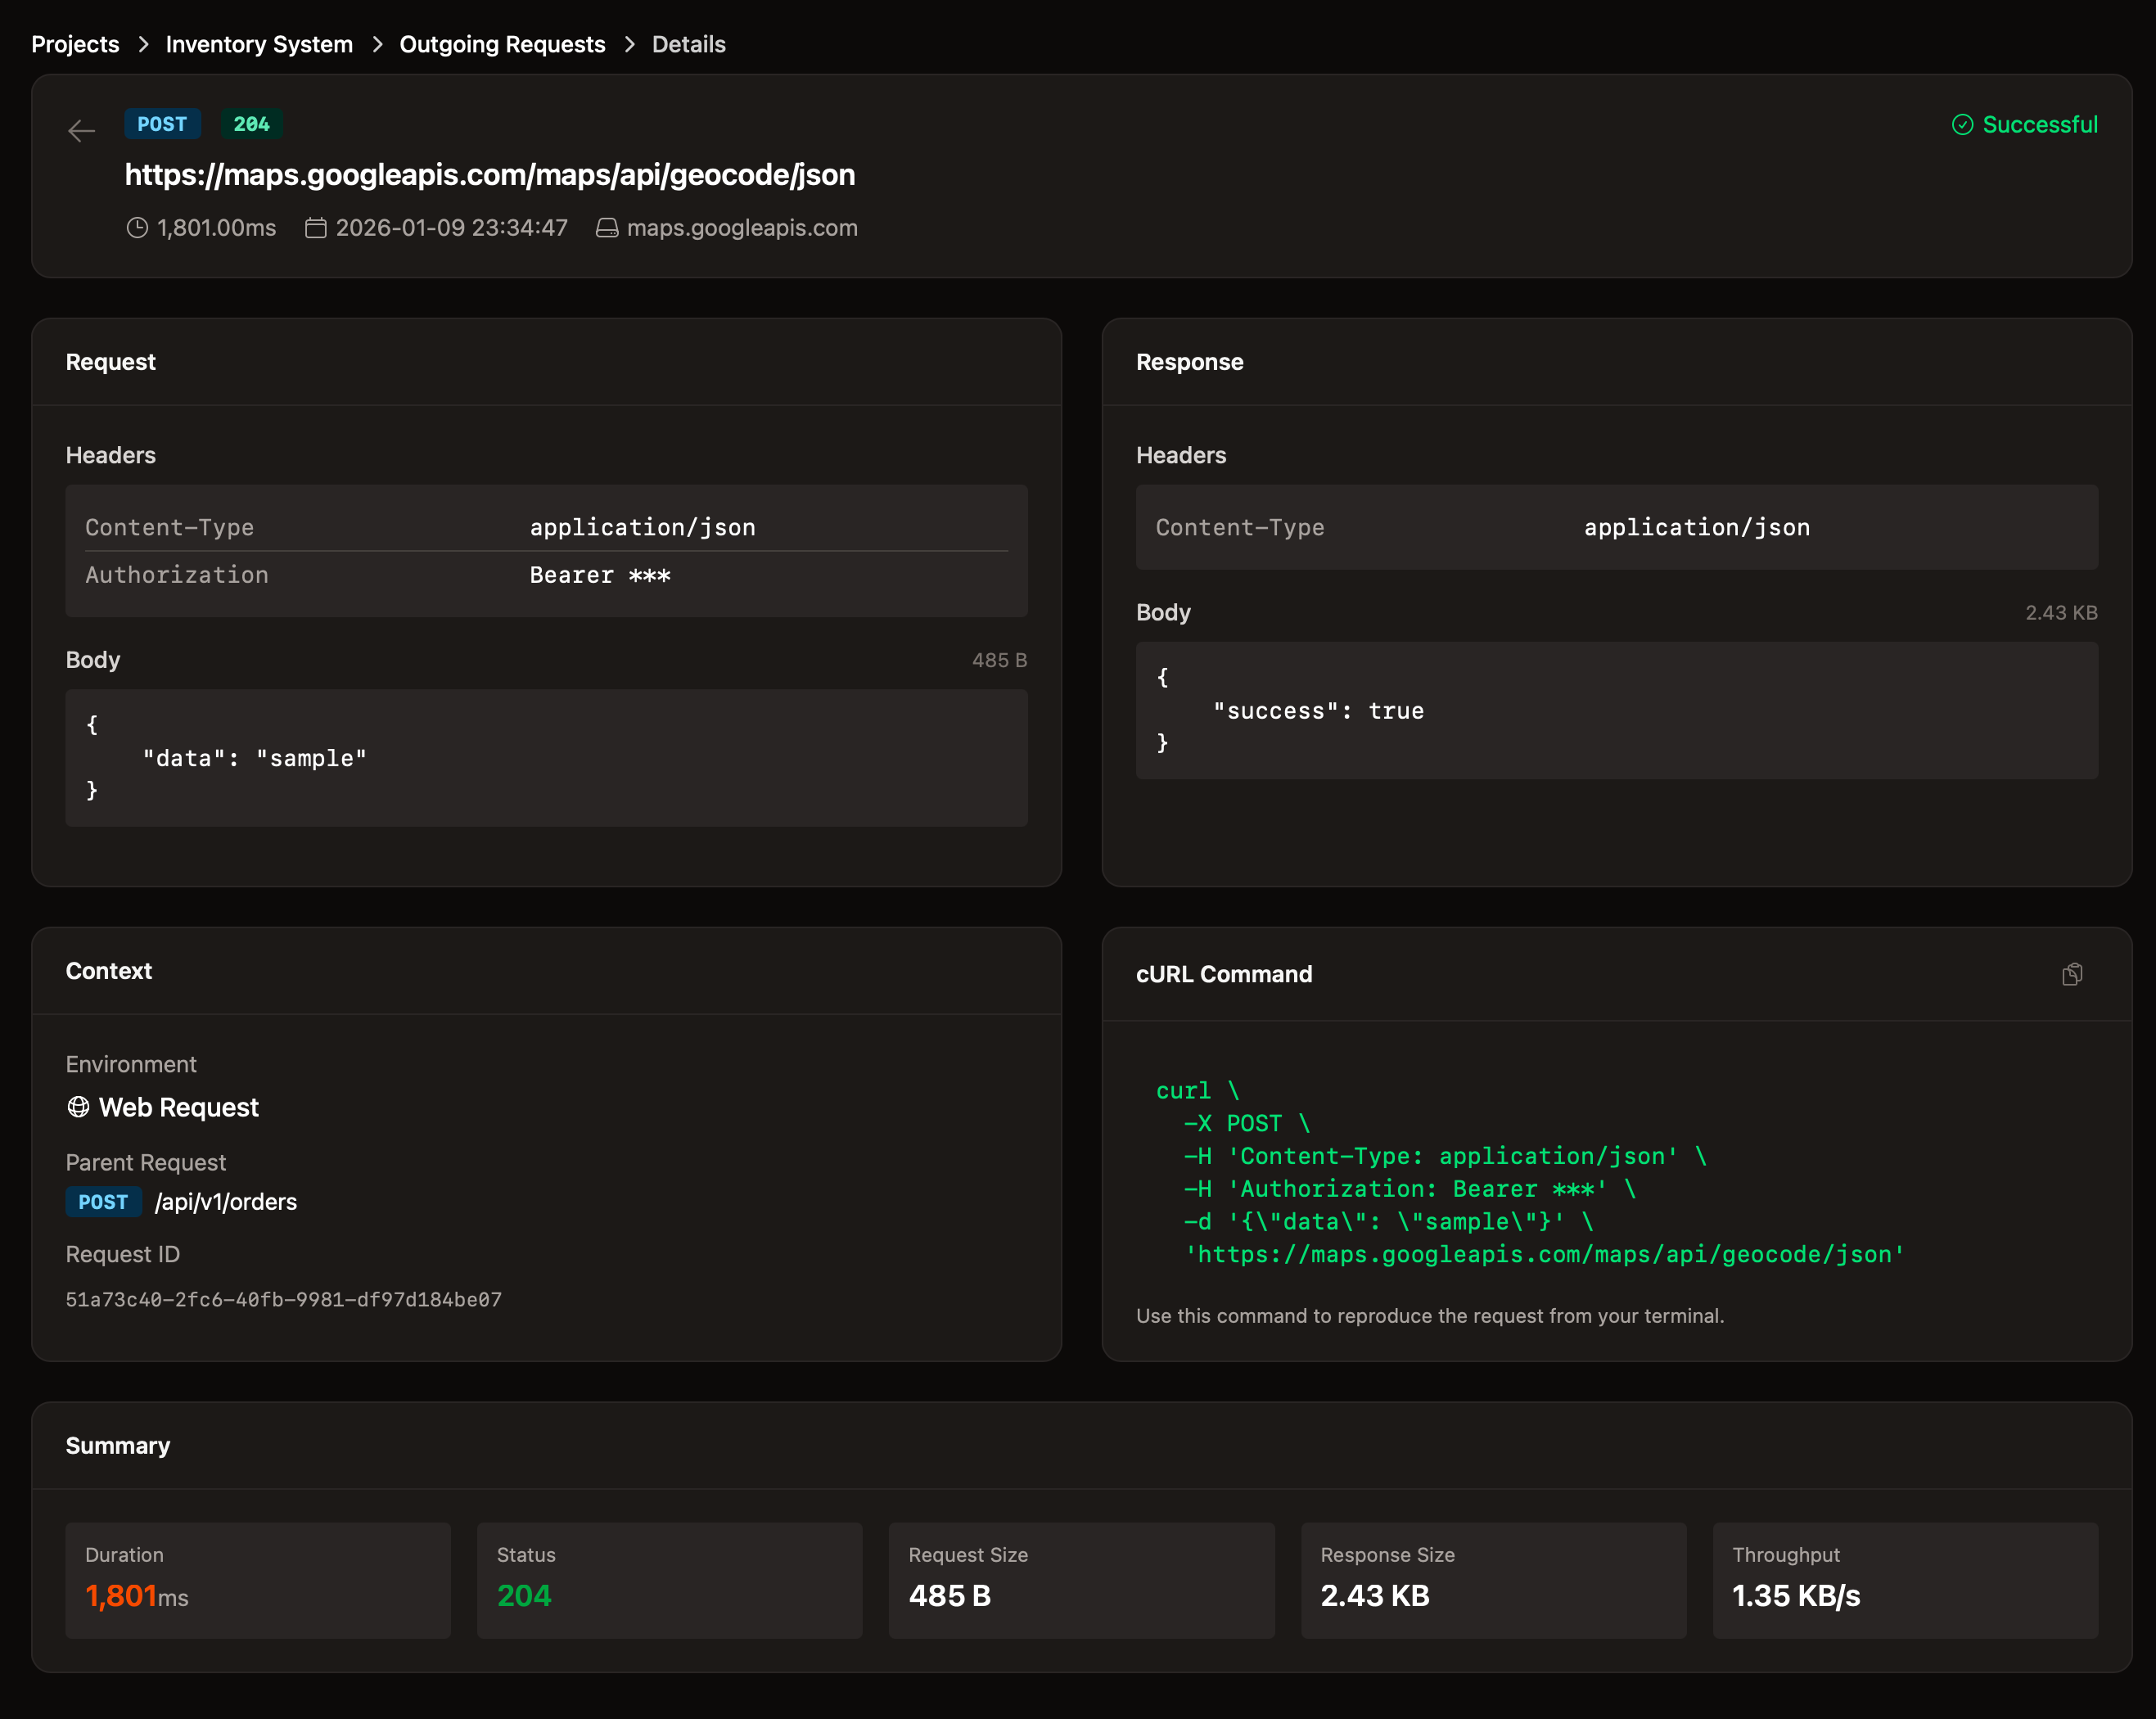
API call details with request/response data
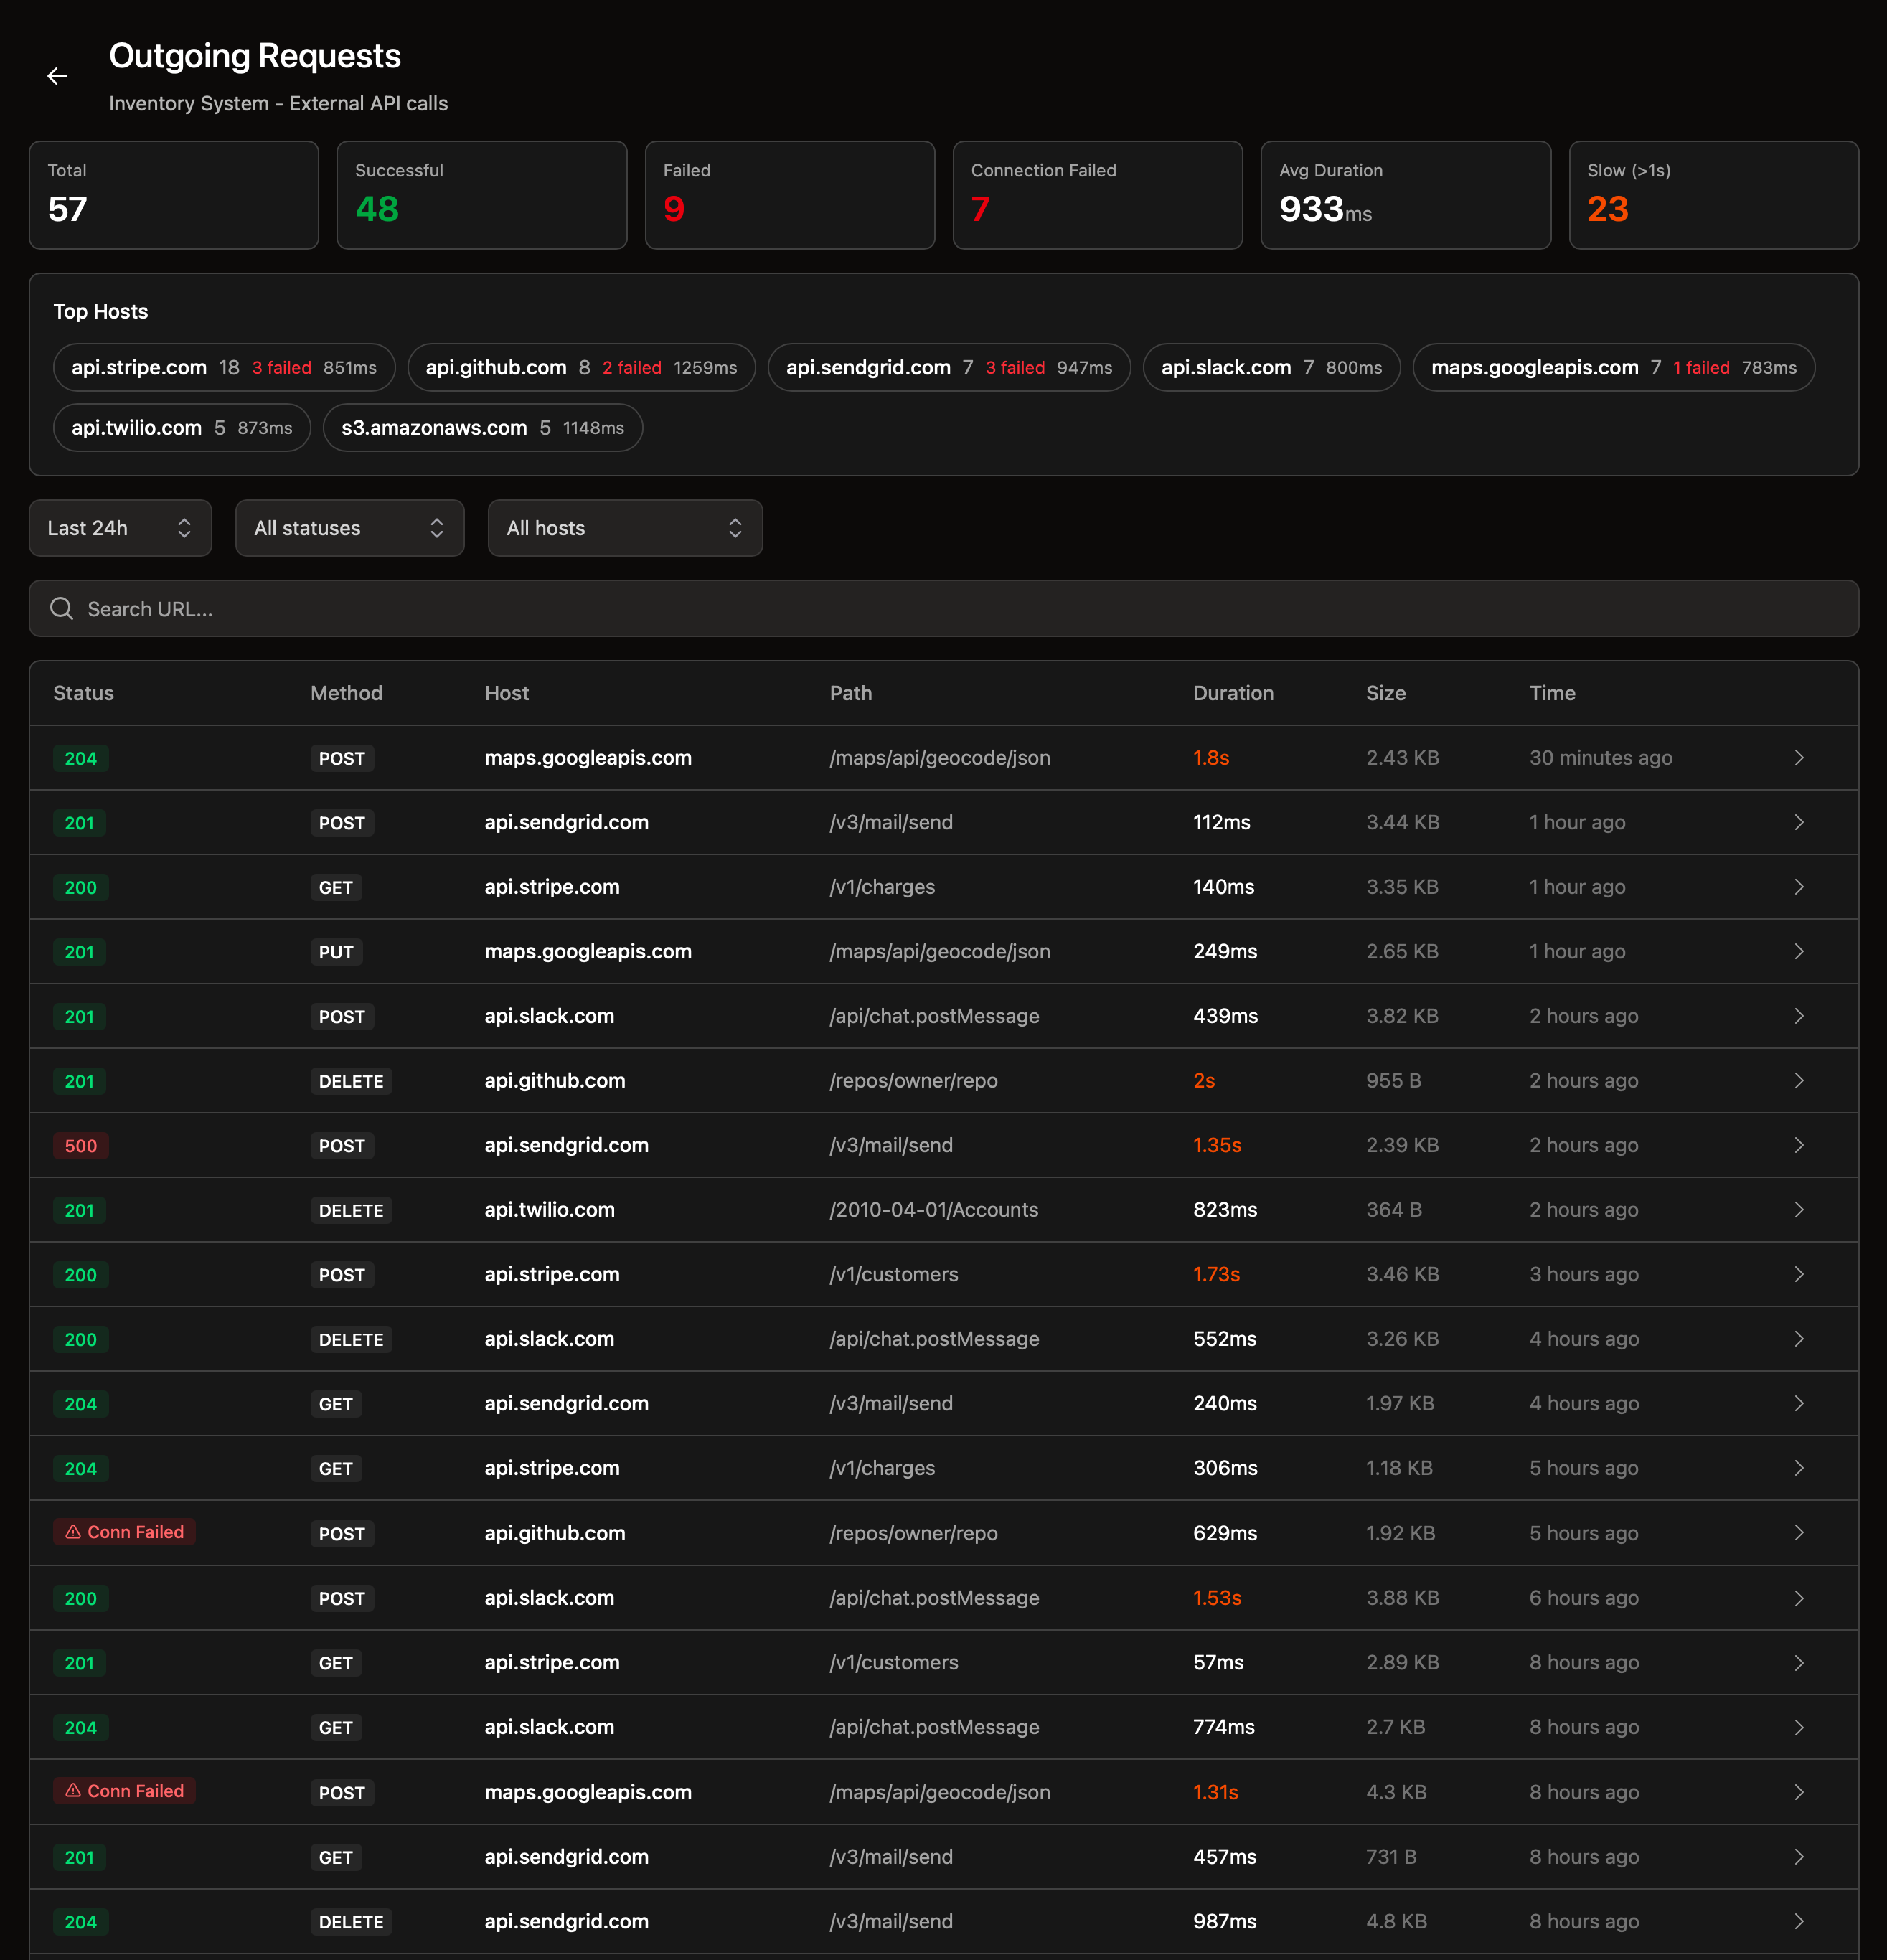
Outgoing API Calls
Track all outgoing HTTP requests your application makes to external APIs. Measure response times, identify failing calls, and monitor your third-party dependencies.
- Group by host and endpoint
- Request and response body display
- Failed calls and timeout alerts
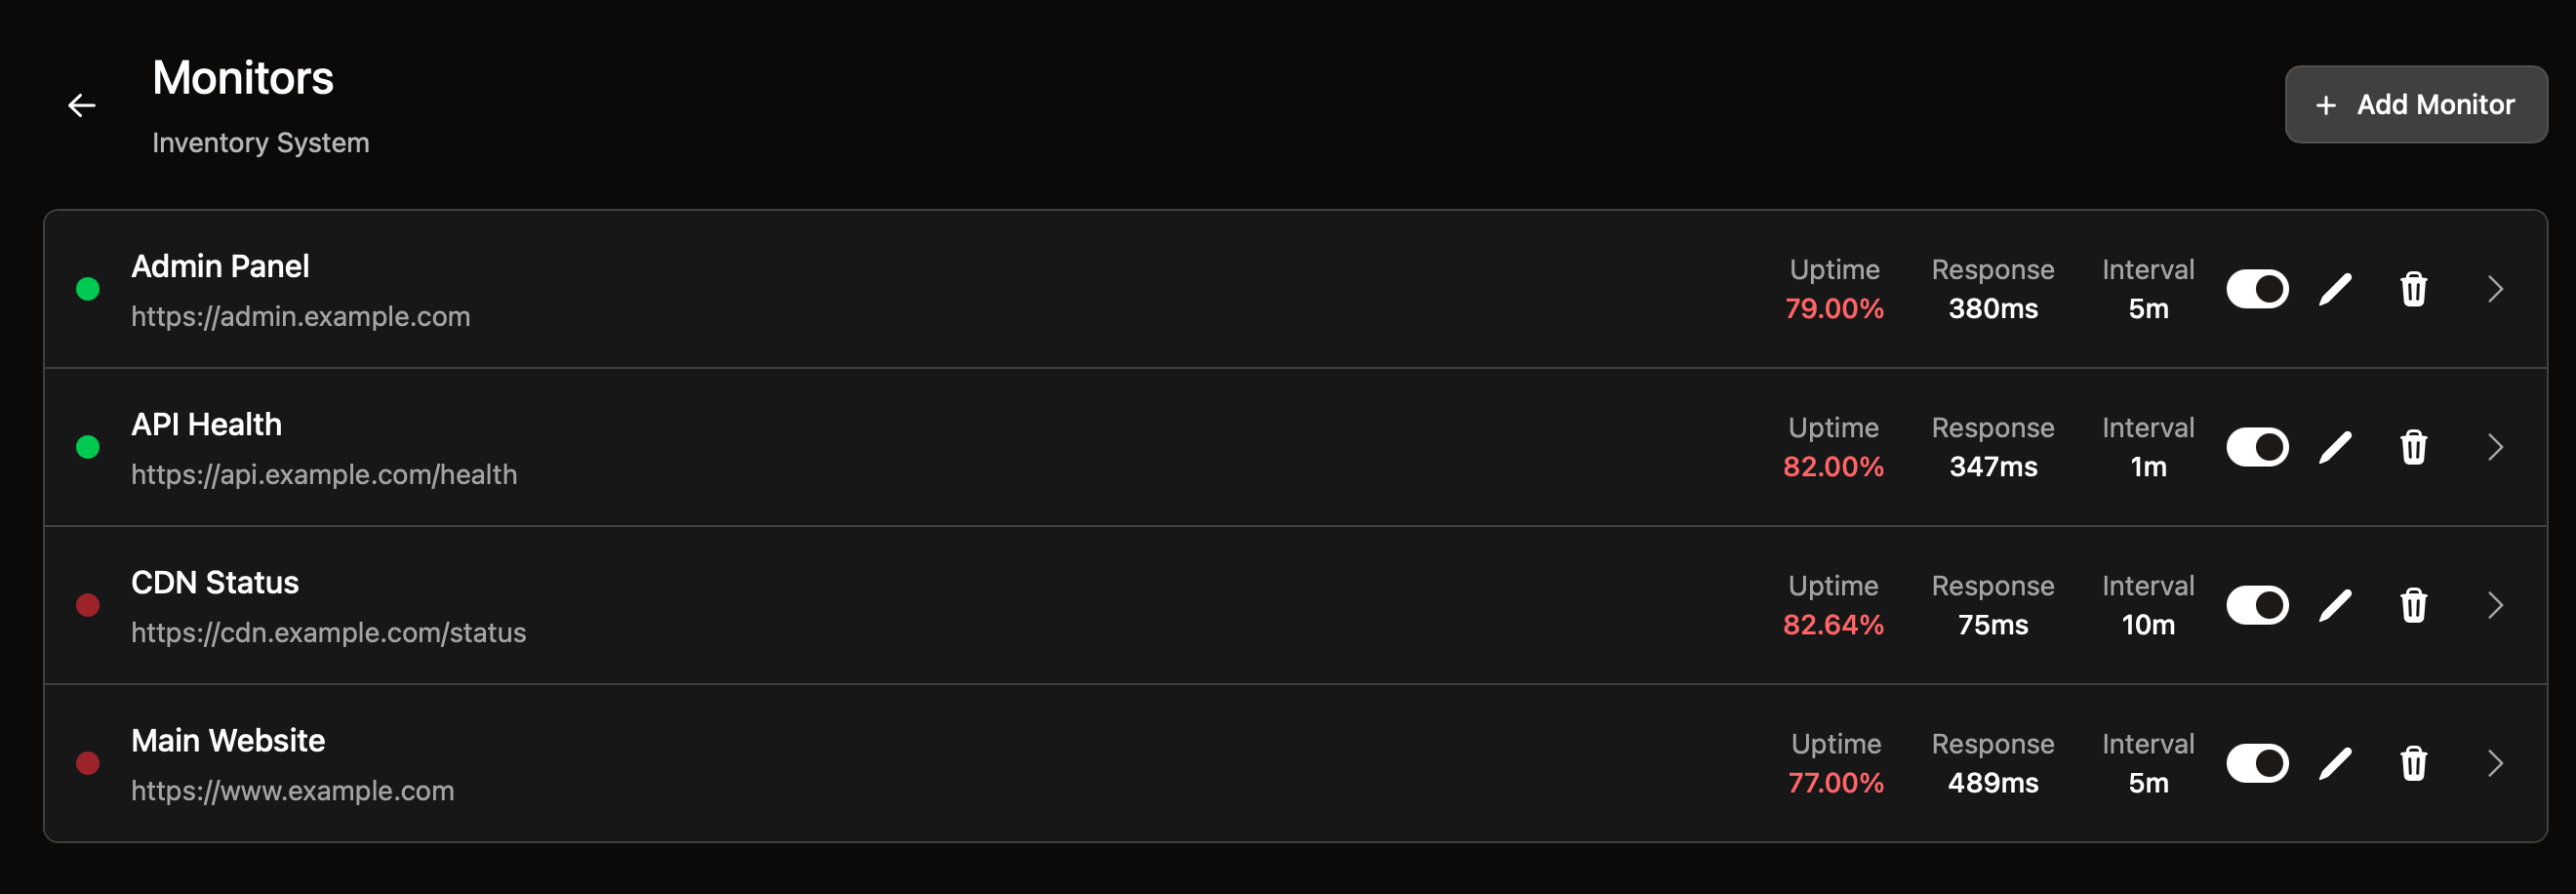
Availability Monitoring
Monitor your endpoints for availability. Get instant alerts when a service goes down. Track response times and uptime history with detailed charts.
- Configurable check intervals
- Incident history and downtime tracking
- Response time charts and statistics
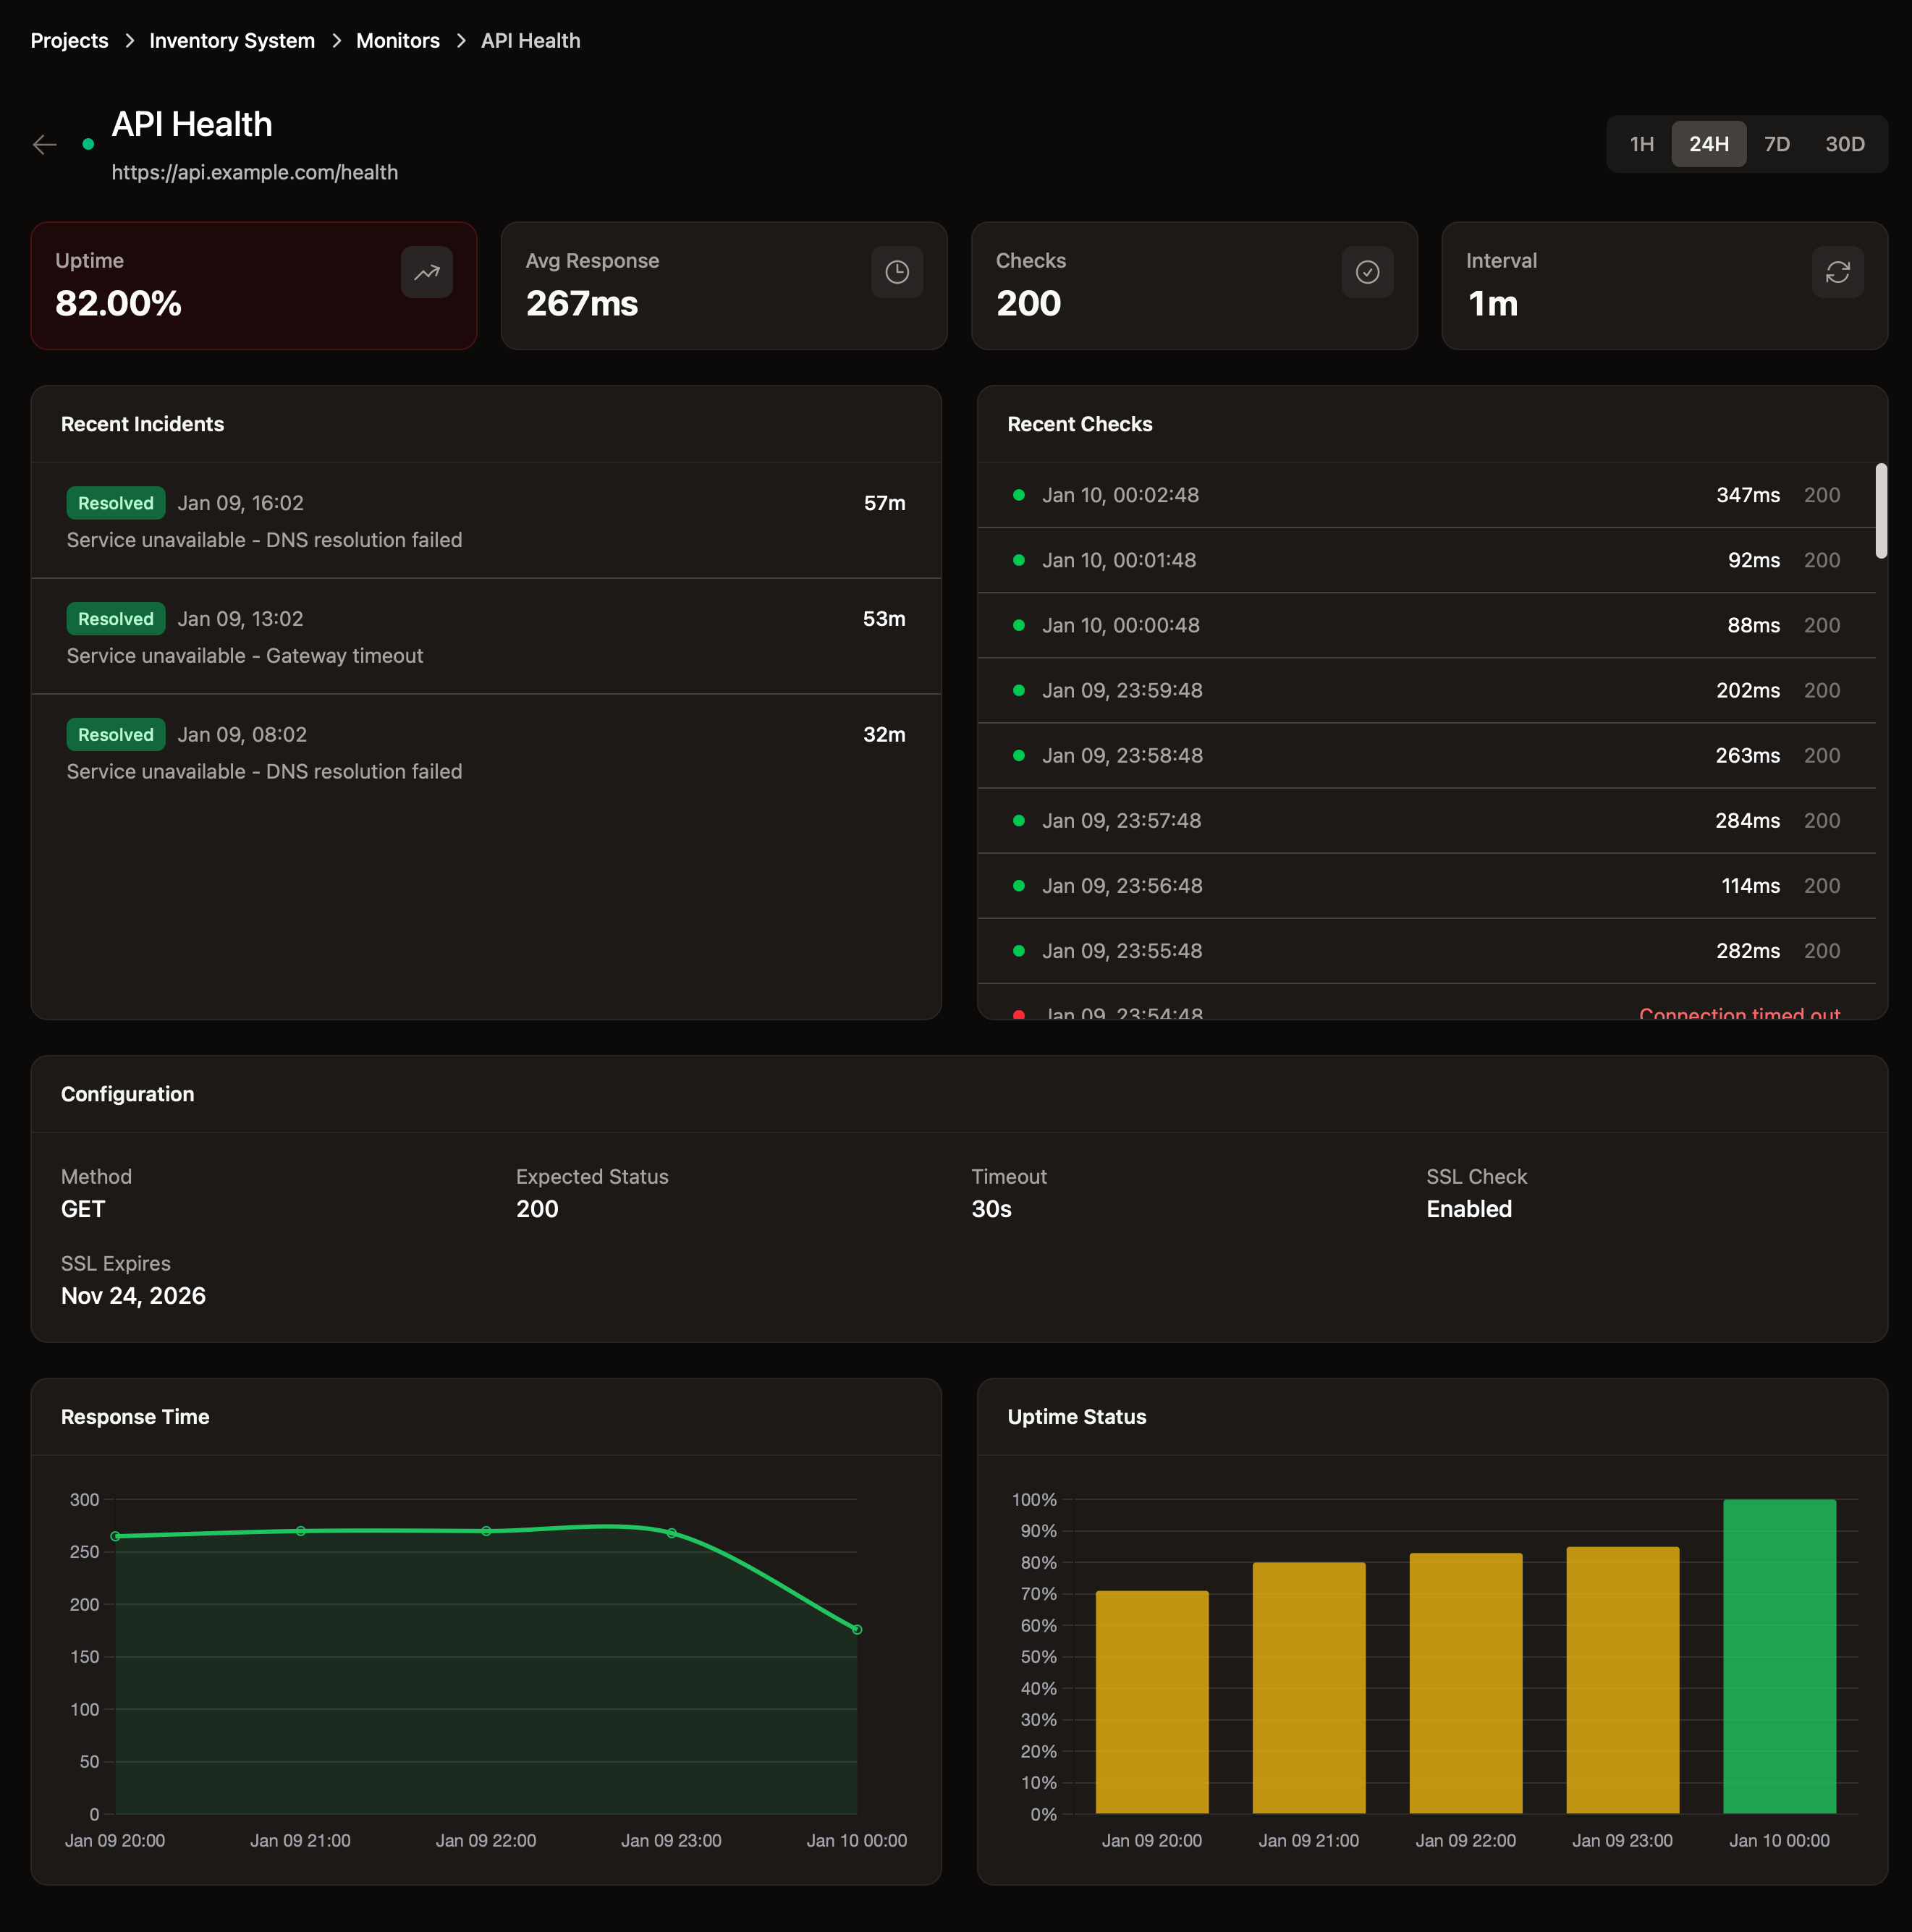
Monitor details with uptime chart
Endpoint Optimization Tracking
Found a slow endpoint? Add it to your watchlist and track your optimization progress over time. Compare baseline performance (before you started watching) with current stats to see exactly how much you've improved.
- One-click watch from any request detail
- Baseline vs current performance comparison
- Improvement percentage tracking
- Query count and duration trends
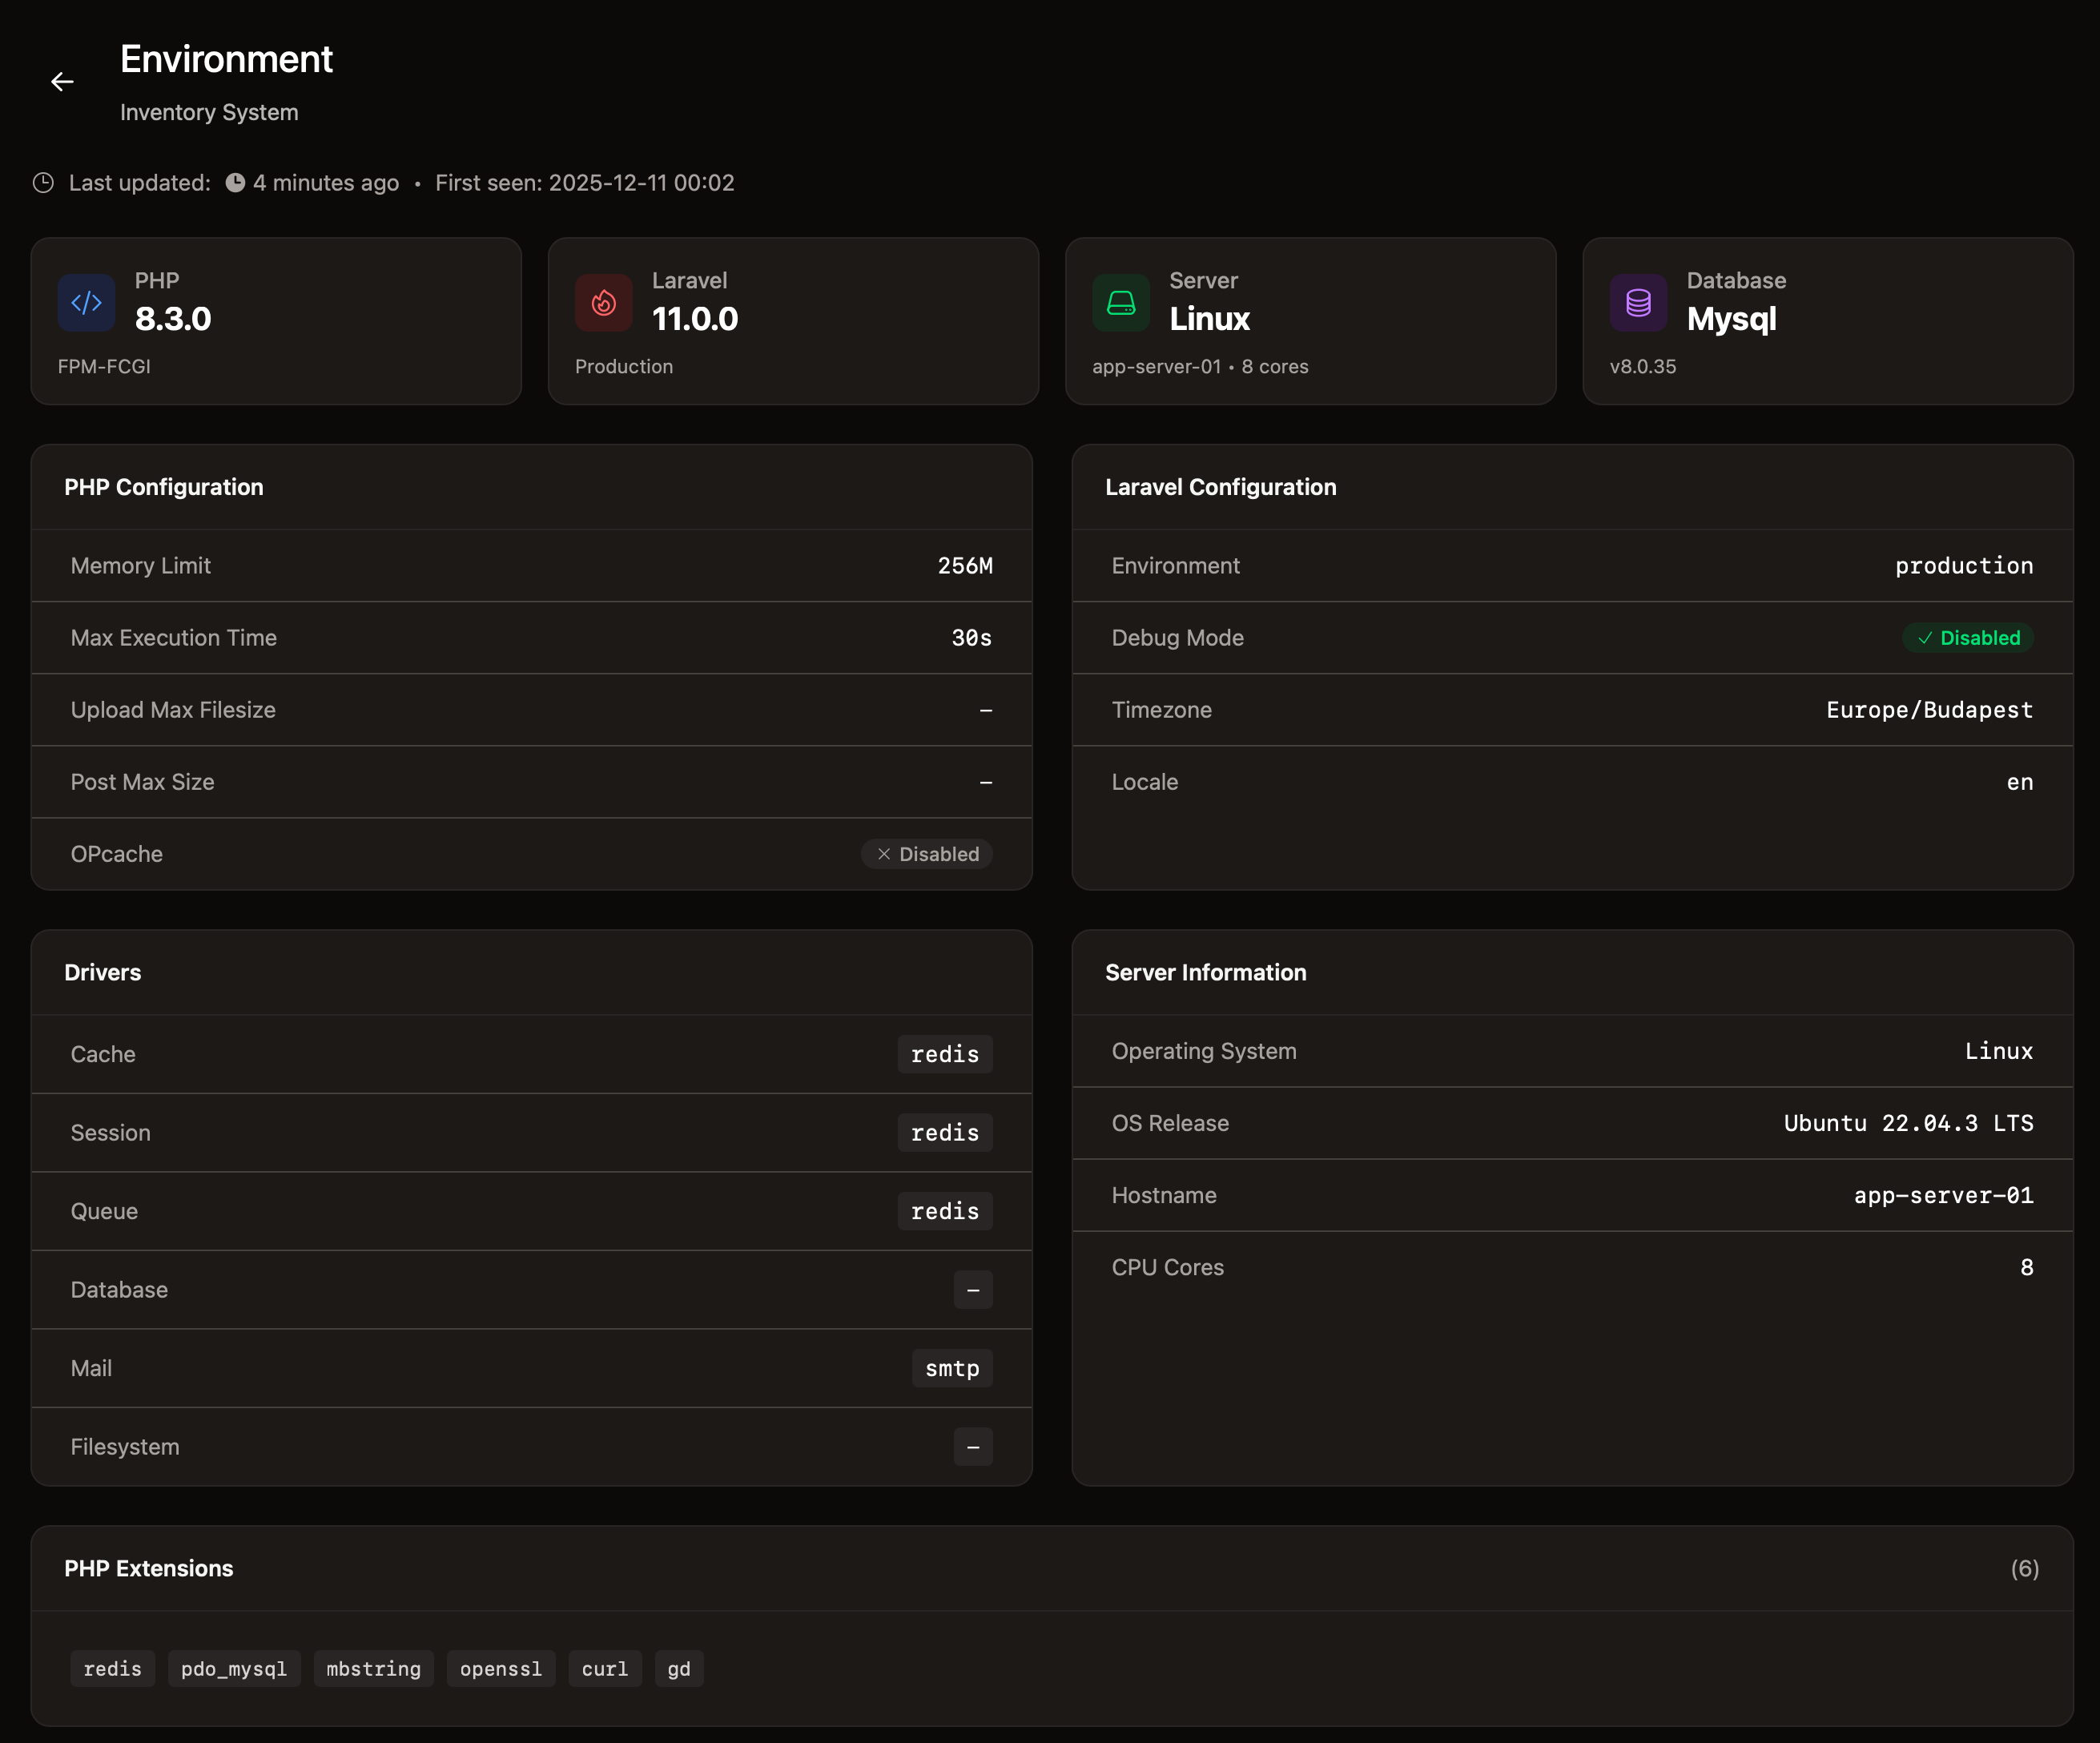
System Information
Complete overview of your server health and application environment. CPU, memory, disk usage, PHP version, Laravel version, and installed packages - all in one place.
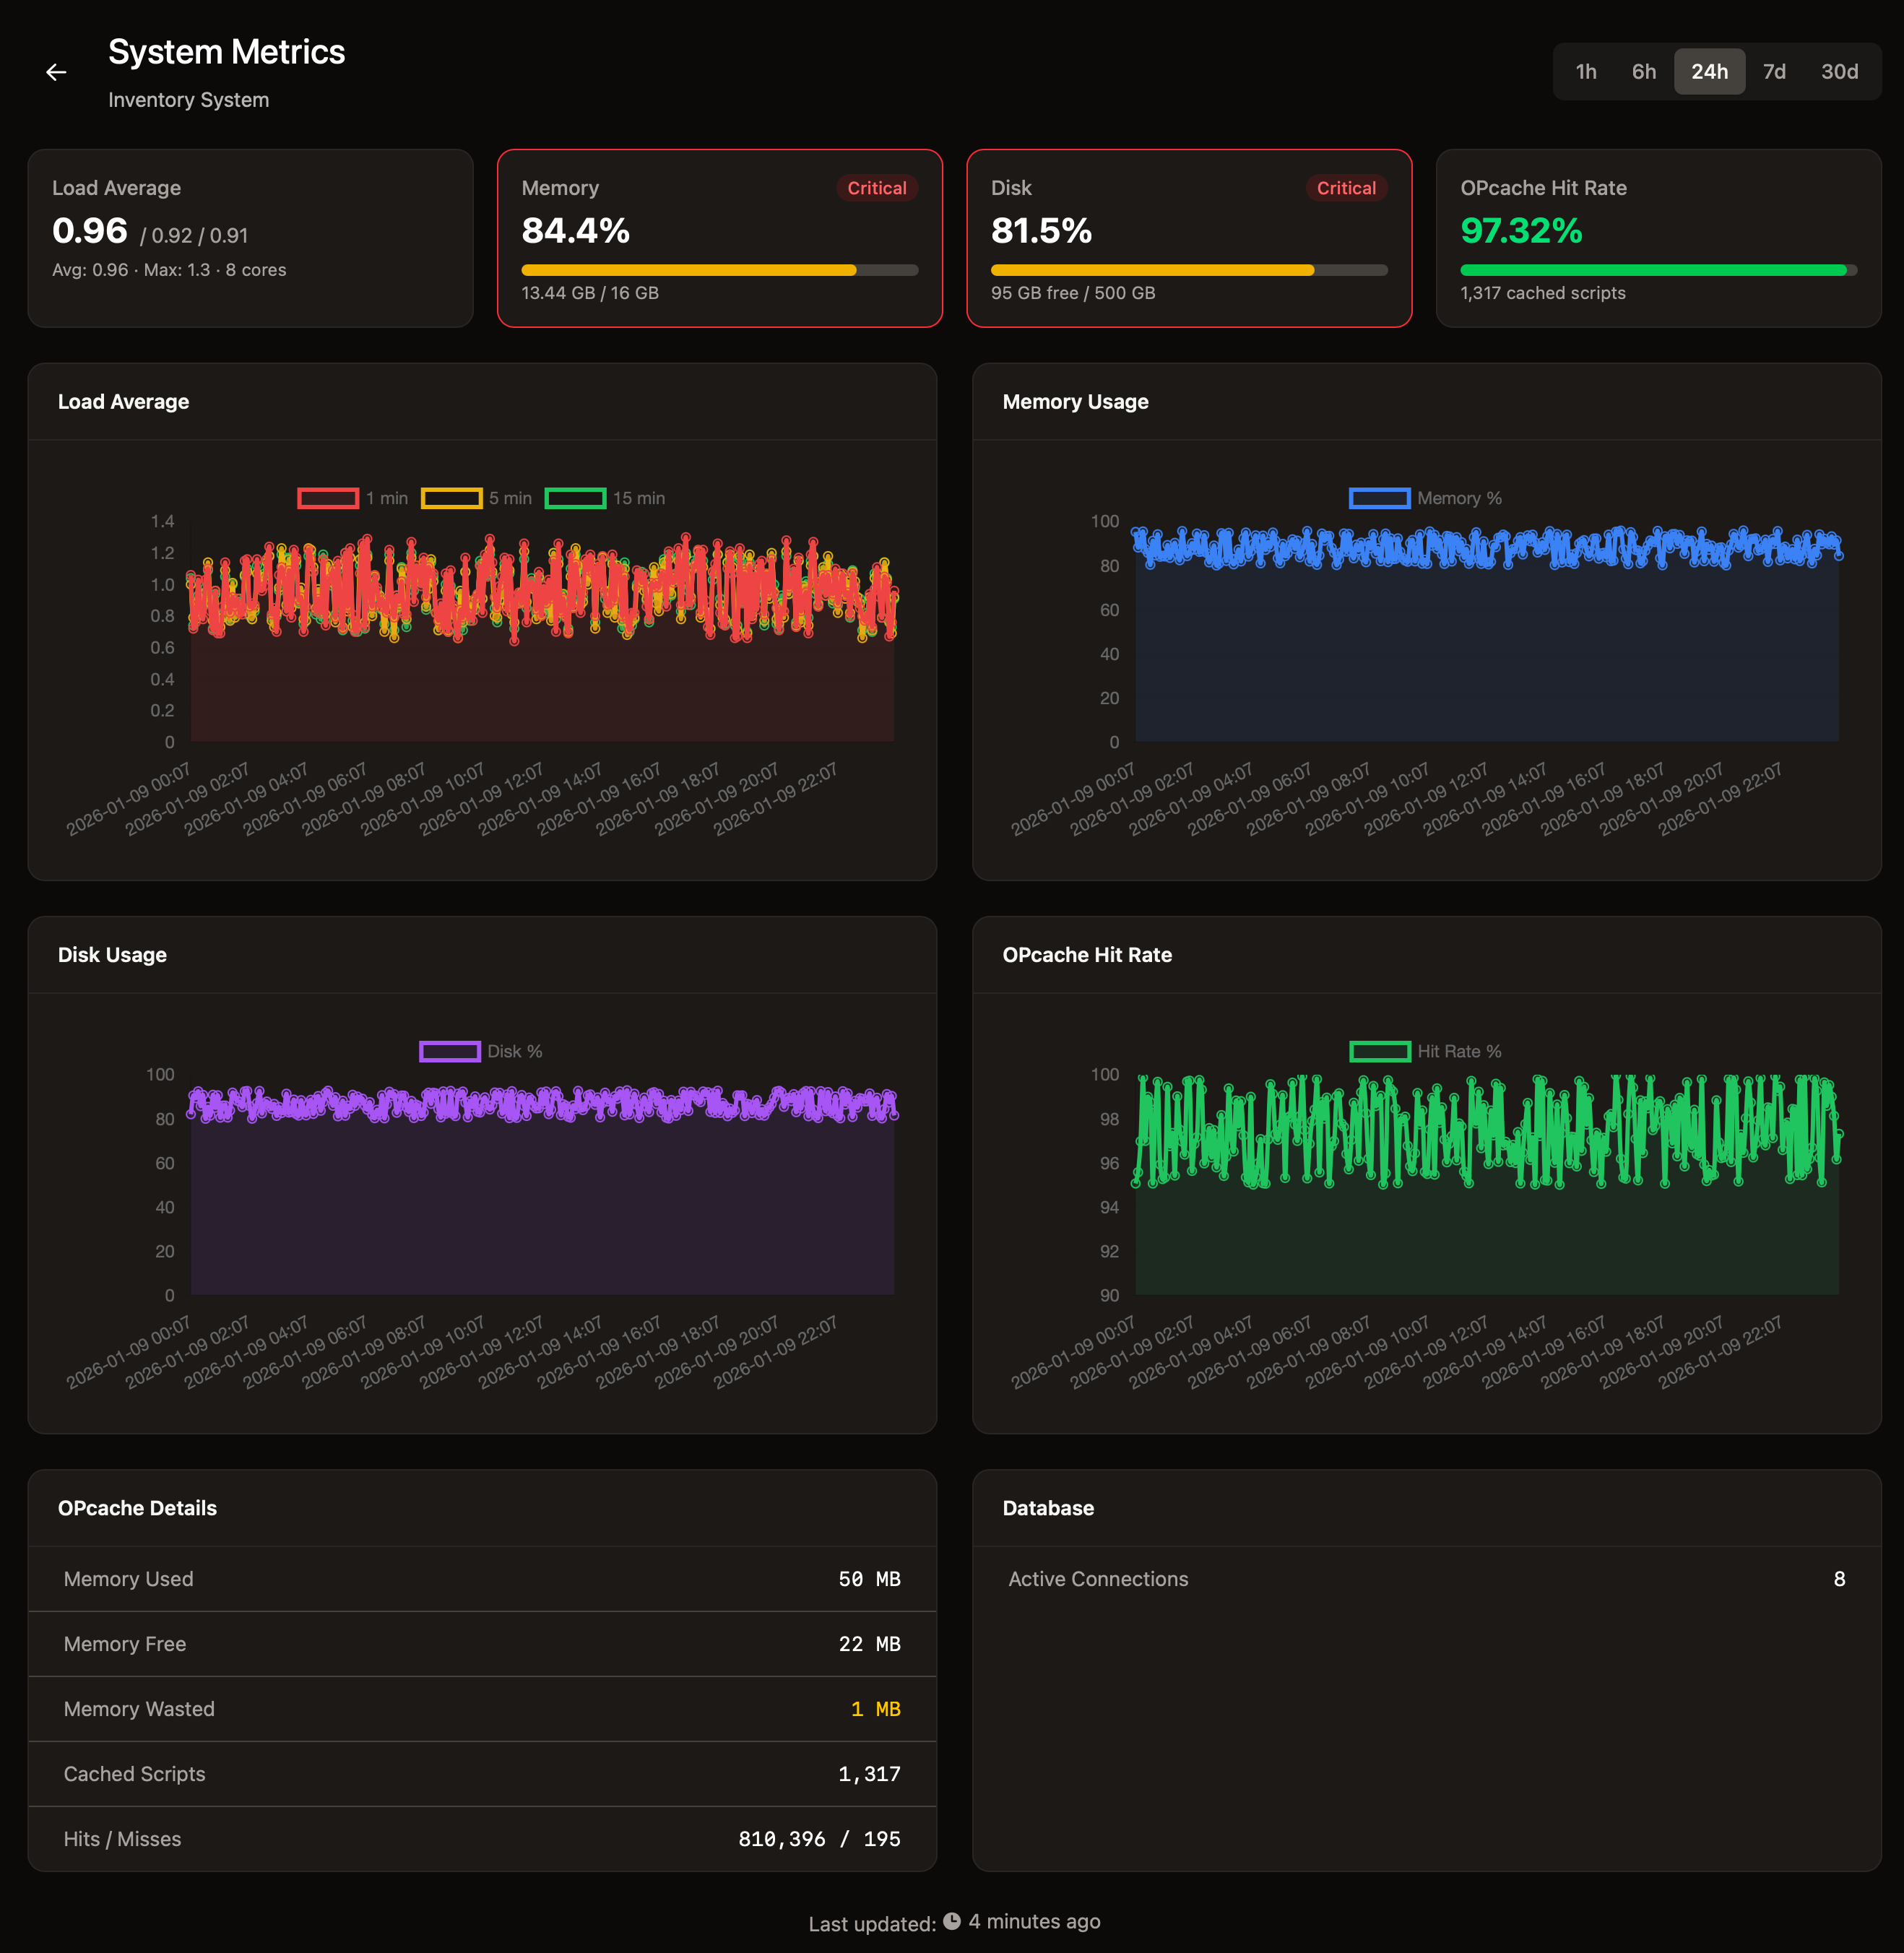
System Metrics
Real-time CPU load, memory and disk usage, OPcache statistics.
Environment Info
PHP and Laravel versions, drivers, installed packages and configurations.